Authors

In part 1: we showed how one can (i) automatically find the Option (of choice) closest to At The Money (ATM) and (ii) calculate its Implied Volatility & Greeks.
In part 2: We will implement a functionality allowing us to apply all we did in Part 1 to expired options. You'll see, it's not as simple as it seems. We will then put it all in one function using Type Hints. This, in itself, will also be rather new and exciting!
Content
Now let's open our session with RD. You can find more information about sessions on EX-4.01.01-Sessions.ipynb.
We're on 'desktop.workspace4' Session
Let's test our connection with 'STXE42500D3.EX^D23', an expired option:
| STXE42500D3.EX^D23 | TRDPRC_1 | SETTLE | BID | ASK |
|---|---|---|---|---|
| Timestamp | ||||
| 2022-11-17 08:40:00 | 55.0 | <NA> | <NA> | <NA> |
| 2022-11-28 15:40:00 | 59.9 | <NA> | <NA> | <NA> |
| ... | ... | ... | ... | ... |
| 2023-04-20 15:20:00 | <NA> | <NA> | 134.0 | 136.1 |
| 2023-04-20 15:30:00 | <NA> | <NA> | 132.2 | 137.8 |
refinitiv.data used in this code is version 1.3.0
numpy used in this code is version 1.23.1
pandas used in this code is version 1.3.5
pandas_market_calendarspytz used in this code is version 4.1.4
requests used in this code is version 2022.1
plotly used in this code is version 2.28.1
FYI (For Your Information), this is out Python version:
Python 3.10.5
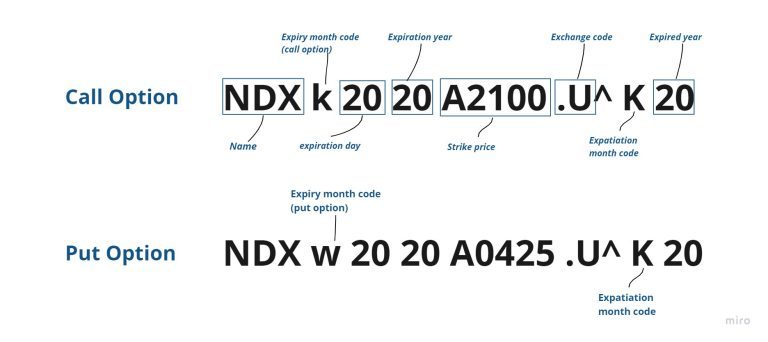
The code in the cell below was written expertly by Haykaz Aramyan in the article 'Functions to find Option RICs traded on different exchanges'. I wanted to introduce in part 2 of this (current) article as it uses complex Python notions such as Classes. We look into reconstructing expired option RICs which have different nomenclatures to live ones:
Below, we put ourselves in the shoes of an analyst backtesting a strategy involving past historical Implied Volatilities. E.g.: if the average 3-business-day historical Implied Volatility of an Option contract is too high, (s)he would not consider it in his(/her) portfolio.
Something to keep in mind is that no intraday price data is available for options that expired 3 months (or more) prior, therefore, when intraday data is not available, daily data will be used.
STOXX50E Usecase
Let's focuss on STOXX50E.
4141.63
('EUX', 'STX', 'EUREX')
Now we can ge the expiry dates for our new senario, based on a time of calculation on "2022-04-01":
{2022: [datetime.date(2022, 1, 21),
datetime.date(2022, 2, 18),
datetime.date(2022, 3, 18),
datetime.date(2022, 4, 14),
datetime.date(2022, 5, 20),
datetime.date(2022, 6, 17),
datetime.date(2022, 7, 15),
datetime.date(2022, 8, 19),
datetime.date(2022, 9, 16),
datetime.date(2022, 10, 21),
datetime.date(2022, 11, 18),
datetime.date(2022, 12, 16)]}
[datetime.datetime(2022, 1, 21, 0, 0),
datetime.datetime(2022, 2, 18, 0, 0),
datetime.datetime(2022, 3, 18, 0, 0),
datetime.datetime(2022, 4, 14, 0, 0),
datetime.datetime(2022, 5, 20, 0, 0),
datetime.datetime(2022, 6, 17, 0, 0),
datetime.datetime(2022, 7, 15, 0, 0),
datetime.datetime(2022, 8, 19, 0, 0),
datetime.datetime(2022, 9, 16, 0, 0),
datetime.datetime(2022, 10, 21, 0, 0),
datetime.datetime(2022, 11, 18, 0, 0),
datetime.datetime(2022, 12, 16, 0, 0)]
Remember, in this use-case, I would like to know what is the next Future (Monthly) Option (i) on the Index '.STOXX50E' (ii) closest to ATM (i.e.: with an underlying spot price closest to the option's strike price) and (iii) Expiring in more than x days (i.e.: not too close to calculated time 't'), let's say 15 days:
datetime.datetime(2022, 5, 20, 0, 0)
We'll need new functions `Get_exp_month` and `Check_RIC`:
Now things are getting tricky.
Certain Expiered Options do not have `TRDPRC_1` data historically. Some don't have `SETTLE`. Some have both...
The below should capture `TRDPRC_1` when it is available, but `SETTLE` might still be present in these instances.
So we will need to build a logic to focus on the series with the most datapoints.
Specifically: Get `TRDPRC_1`. If there are fewer `TRDPRC_1` datapoionts than days (i.e.: if there's only daily data for this field), get `SETTLE`. Same again, if not `SETTLE`, then get the midpoint between `BID` and `ASK`.
Now we can get EUREX RIC:
Note that this function, `Get_RIC_eurex`, needs a round number as strike price:
4141.63 as int: 4100
'STXE41000Q2.EX^E22'
| STXE41000Q2.EX^E22 | TRDPRC_1 |
|---|---|
| Date | |
| 2022-02-22 | 269.8 |
| 2022-02-28 | 363.0 |
| 2022-03-01 | 380.7 |
| 2022-03-04 | 576.8 |
| 2022-03-15 | 551.2 |
| 2022-03-22 | 286.5 |
| 2022-04-04 | 286.1 |
| 2022-04-12 | 345.9 |
| 2022-04-13 | 350.0 |
| 2022-04-25 | 378.2 |
| 2022-04-28 | 374.8 |
| 2022-05-18 | 373.0 |
Creating a class with PEP 3107 (a.k.a.: Type Hints)
We are now going to look into using PEP 3107 (and PEP 484) (and some decorators). In line with PEP, I will also now use PEP8 naming conventions.
Version 1.0.5
Version 1.0.5
Let's test our Type Hint library:
<cell>4: error: Argument 1 to "myfunc" has incompatible type "str"; expected "int" [arg-type]
test
Now let's recreate what we did above, but with Type Hints. We will alsop continue using them from now on.
refinitiv.data used in this code is version 1.3.0
numpy used in this code is version 1.23.1
pandas used in this code is version 1.3.5
pandas_market_calendarspytz used in this code is version 4.1.4
requests used in this code is version 2022.1
plotly used in this code is version 2.28.1
4139.28
('EUX', 'STX', 'EUREX')
{'year': int,
'days': bool,
'mcal_get_calendar': str,
'return': dict[int, list[typing.Any]]}
[datetime.date(2022, 1, 21),
datetime.date(2022, 2, 18),
datetime.date(2022, 3, 18),
datetime.date(2022, 4, 14),
datetime.date(2022, 5, 20),
datetime.date(2022, 6, 17),
datetime.date(2022, 7, 15),
datetime.date(2022, 8, 19),
datetime.date(2022, 9, 16),
datetime.date(2022, 10, 21),
datetime.date(2022, 11, 18),
datetime.date(2022, 12, 16)]
datetime.datetime(2022, 5, 20, 0, 0)
({1: {'exp': 'A', 'C': 'A', 'P': 'M'},
2: {'exp': 'B', 'C': 'B', 'P': 'N'},
3: {'exp': 'C', 'C': 'C', 'P': 'O'},
4: {'exp': 'D', 'C': 'D', 'P': 'P'},
5: {'exp': 'E', 'C': 'E', 'P': 'Q'},
6: {'exp': 'F', 'C': 'F', 'P': 'R'},
7: {'exp': 'G', 'C': 'G', 'P': 'S'},
8: {'exp': 'H', 'C': 'H', 'P': 'T'},
9: {'exp': 'I', 'C': 'I', 'P': 'U'},
10: {'exp': 'J', 'C': 'J', 'P': 'V'},
11: {'exp': 'K', 'C': 'K', 'P': 'W'},
12: {'exp': 'L', 'C': 'L', 'P': 'X'}},
'Q')
datetime.datetime(2022, 5, 20, 0, 0)
'2022-02-19'
'STXE41000Q2.EX^E22'
| STXE41000Q2.EX^E22 | TRDPRC_1 |
|---|---|
| Date | |
| 2022-02-22 | 269.8 |
| 2022-02-28 | 363.0 |
| ... | ... |
| 2022-04-28 | 374.8 |
| 2022-05-18 | 373.0 |
| Instrument | CF_CURR | |
|---|---|---|
| 0 | .HSI | HKD |
{'valid_ric': [{'HSI20200N3.HF^B23': HSI20200N3.HF^B23 TRDPRC_1
Timestamp
2022-12-28 03:06:00 864
2022-12-28 03:08:00 855
... ...
2023-02-01 15:39:00 76
2023-02-01 16:59:00 74
[645 rows x 1 columns]}],
'potential_rics': []}
| HSI20200N3.HF^B23 | TRDPRC_1 |
|---|---|
| Timestamp | |
| 2022-12-28 03:06:00 | 864 |
| 2022-12-28 03:08:00 | 855 |
| 2023-01-03 15:14:00 | 805 |
| 2023-01-04 05:02:00 | 661 |
| 2023-01-04 05:04:00 | 655 |
4273.53
{'valid_ric': [{'SPXs152243000.U^G22': SPXs152243000.U^G22 TRDPRC_1
Date
2021-06-29 320.93
2021-07-01 320.64
... ...
2022-07-13 491.8
2022-07-14 505.0
[181 rows x 1 columns]}],
'potential_rics': []}
dict_keys(['SPXs152243000.U^G22'])
'SPXs152243000.U^G22'
| SPXs152243000.U^G22 | TRDPRC_1 |
|---|---|
| Date | |
| 2021-06-29 | 320.93 |
| 2021-07-01 | 320.64 |
| ... | ... |
| 2022-07-13 | 491.8 |
| 2022-07-14 | 505.0 |
Implied Volatility and Greeks of Expired Options (Historical Daily series)
The most granular Historical Options' price data kept are daily time-series. This daily data is captured by the above `OptionRIC().Construct_RIC()` function. Some Options' historical price data is most "wholesome" (in this case, "has the least amount of `NaN`s" - Not a Number) under the field name `TRDPRC_1`, some under `SETTLE`. While our preference - ceteris paribus (all else equal) - is `TRDPRC_1`, more "wholesome" data-sets are still preferable, so the "fullest prices" in `OptionRIC().Construct_RIC()` picks the series with fewest `NaN`s.
'20200'
| HK3MT=RR | Mid Price |
|---|---|
| Date | |
| 2022-12-28 | 0.6565 |
| 2022-12-29 | 0.666 |
| 2022-12-30 | 0.678 |
| HSI20200N3.HF^B23 | OptionPrice | RfRatePrct |
|---|---|---|
| Timestamp | ||
| 2022-12-28 03:06:00 | 864 | 0.6565 |
| 2022-12-28 03:08:00 | 855 | 0.6565 |
| 2023-01-03 15:14:00 | 805 | 0.7605 |
| 2023-01-04 05:02:00 | 661 | 0.7255 |
| 2023-01-04 05:04:00 | 655 | 0.7255 |
| .HSI | TRDPRC_1 |
|---|---|
| Date | |
| 2022-12-29 | 19741.14 |
| 2022-12-30 | 19781.41 |
| HSI20200N3.HF^B23 | OptionPrice | RfRatePrct | UndrlyingPr |
|---|---|---|---|
| Timestamp | |||
| 2022-12-28 03:06:00 | 864 | 0.6565 | <NA> |
| 2022-12-28 03:08:00 | 855 | 0.6565 | <NA> |
| ... | ... | ... | ... |
| 2023-02-01 15:39:00 | 76 | 0.5925 | 22072.18 |
| 2023-02-01 16:59:00 | 74 | 0.5925 | 22072.18 |
'2023-02-02'
Batch of 100 requests no. 1/7 started
Batch of 100 requests no. 2/7 started
Batch of 100 requests no. 3/7 started
Batch of 100 requests no. 4/7 started
Batch of 100 requests no. 5/7 started
Batch of 100 requests no. 6/7 started
Batch of 43 requests no. 7/7 started
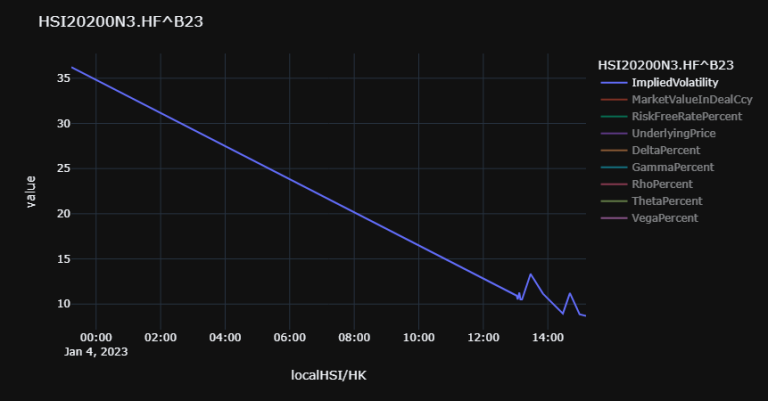
| HSI20200N3.HF^B23 | ImpliedVolatility | MarketValueInDealCcy | RiskFreeRatePercent | UnderlyingPrice | DeltaPercent | GammaPercent | RhoPercent | ThetaPercent | VegaPercent |
|---|---|---|---|---|---|---|---|---|---|
| Timestamp | |||||||||
| 2023-01-03 15:14:00 | 37.699964 | 805 | 0.7605 | 20145.29 | 0.499444 | 0.000185 | 7.447067 | -13.639386 | 22.720151 |
| 2023-01-04 05:02:00 | 14.075574 | 661 | 0.7255 | 20793.11 | 0.751228 | 0.000382 | 11.799572 | -3.060431 | 18.355369 |
| ... | ... | ... | ... | ... | ... | ... | ... | ... | ... |
| 2023-01-04 08:19:00 | 8.970256 | 578 | 0.7255 | 20793.11 | 0.852918 | 0.000434 | 13.468556 | -0.449749 | 13.198607 |
| 2023-01-04 08:27:00 | 9.194755 | 581 | 0.7255 | 20793.11 | 0.847142 | 0.000434 | 13.369321 | -0.569076 | 13.55007 |
Sort Out Time Zones
All data from the RDP endpoints are in GMT. We will keep the index for GMT, so we don't loose this information, but we will also add a Local Timezone, as this is what interests us. To do so, let's use MultyIndex:
Now let's focus on data within trading hours (just in case there are 'Ask's or 'BID's sent outside of trading hours):

| HSI20200N3.HF^B23 | ImpliedVolatility | MarketValueInDealCcy | RiskFreeRatePercent | UnderlyingPrice | DeltaPercent | GammaPercent | RhoPercent | ThetaPercent | VegaPercent | ||
|---|---|---|---|---|---|---|---|---|---|---|---|
| localHSI/HK | gmt | cet | |||||||||
| 2023-01-03 23:14:00+08:00 | 2023-01-03 15:14:00+00:00 | 2023-01-03 16:14:00+01:00 | 37.699964 | 805 | 0.7605 | 20145.29 | 0.499444 | 0.000185 | 7.447067 | -13.639386 | 22.720151 |
| 2023-01-04 13:02:00+08:00 | 2023-01-04 05:02:00+00:00 | 2023-01-04 06:02:00+01:00 | 14.075574 | 661 | 0.7255 | 20793.11 | 0.751228 | 0.000382 | 11.799572 | -3.060431 | 18.355369 |
| ... | ... | ... | ... | ... | ... | ... | ... | ... | ... | ... | ... |
| 2023-01-04 16:19:00+08:00 | 2023-01-04 08:19:00+00:00 | 2023-01-04 09:19:00+01:00 | 8.970256 | 578 | 0.7255 | 20793.11 | 0.852918 | 0.000434 | 13.468556 | -0.449749 | 13.198607 |
| 2023-01-04 16:27:00+08:00 | 2023-01-04 08:27:00+00:00 | 2023-01-04 09:27:00+01:00 | 9.194755 | 581 | 0.7255 | 20793.11 | 0.847142 | 0.000434 | 13.369321 | -0.569076 | 13.55007 |
| ErrorMessage | AverageSoFar | AverageType | BarrierLevel | BarrierType | BreakEvenDeltaAmountInDealCcy | BreakEvenDeltaAmountInReportCcy | BreakEvenPriceInDealCcy | BreakEvenPriceInReportCcy | CallPut | ... | VegaAmountInReportCcy | VegaPercent | Volatility | VolatilityPercent | VolatilityType | VolgaAmountInDealCcy | VolgaAmountInReportCcy | YearsToExpiry | ZommaAmountInDealCcy | ZommaAmountInReportCcy | |
|---|---|---|---|---|---|---|---|---|---|---|---|---|---|---|---|---|---|---|---|---|---|
| 0 | None | NaN | None | 0.363338 | 0.363338 | 21005.0 | 21005.0 | CALL | ... | 22.784895 | 22.784895 | 36.213723 | 36.213723 | Calculated | -13.959693 | -13.959693 | 0.079452 | -0.000533 | -0.000533 | ||
| 1 | None | NaN | None | 0.471196 | 0.471196 | 20861.0 | 20861.0 | CALL | ... | 14.460623 | 14.460623 | 10.930215 | 10.930215 | Calculated | 12222.331425 | 12222.331425 | 0.079452 | -0.00027 | -0.00027 | ||
| ... | ... | ... | ... | ... | ... | ... | ... | ... | ... | ... | ... | ... | ... | ... | ... | ... | ... | ... | ... | ... | ... |
| 641 | Unable to calculate the Implied Volatility. | None | NaN | None | NaN | NaN | 20276.0 | 20276.0 | CALL | ... | NaN | NaN | None | None | Calculated | NaN | NaN | 0.002666 | NaN | NaN | |
| 642 | Unable to calculate the Implied Volatility. | None | NaN | None | NaN | NaN | 20274.0 | 20274.0 | CALL | ... | NaN | NaN | None | None | Calculated | NaN | NaN | 0.002513 | NaN | NaN |
| HSI20200N3.HF^B23 | ImpliedVolatility | MarketValueInDealCcy | RiskFreeRatePercent | UnderlyingPrice | DeltaPercent | GammaPercent | RhoPercent | ThetaPercent | VegaPercent |
|---|---|---|---|---|---|---|---|---|---|
| localHSI/HK | |||||||||
| 2023-01-03 23:14:00+08:00 | 36.213723 | 805.0 | 0.7605 | 20145.29 | 0.512321 | 0.000193 | 7.655776 | -14.246864 | 22.784895 |
| 2023-01-04 13:02:00+08:00 | 10.930215 | 661.0 | 0.7255 | 20793.11 | 0.835625 | 0.000388 | 13.183778 | -3.076009 | 14.460623 |
| ... | ... | ... | ... | ... | ... | ... | ... | ... | ... |
| 2023-01-04 14:59:00+08:00 | 8.869543 | 634.0 | 0.7255 | 20793.11 | 0.884672 | 0.000376 | 13.969961 | -2.1038 | 11.342056 |
| 2023-01-04 15:11:00+08:00 | 8.692169 | 632.0 | 0.7255 | 20793.11 | 0.889297 | 0.000373 | 14.04309 | -2.021522 | 11.01396 |
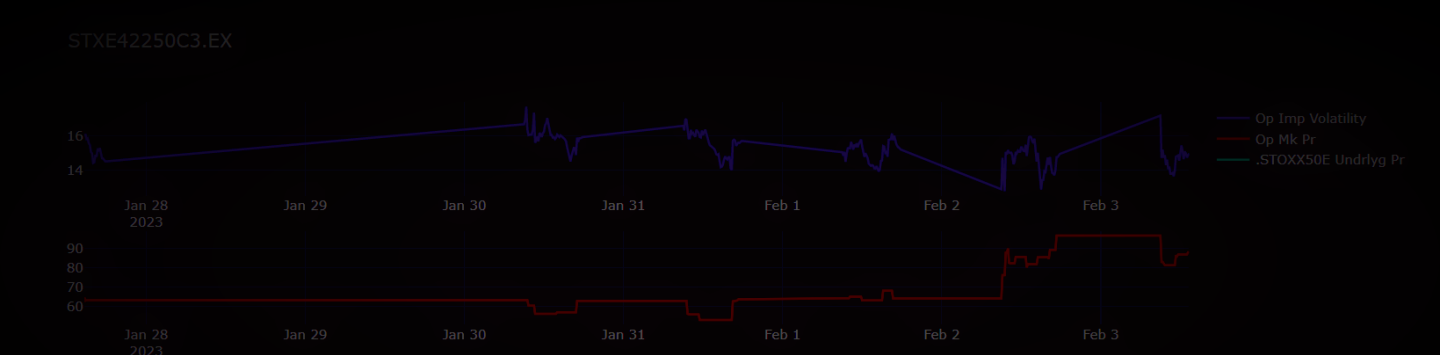
The whole Class was too large to leave here, on this article. Do not hesitate to read it in GitHub.
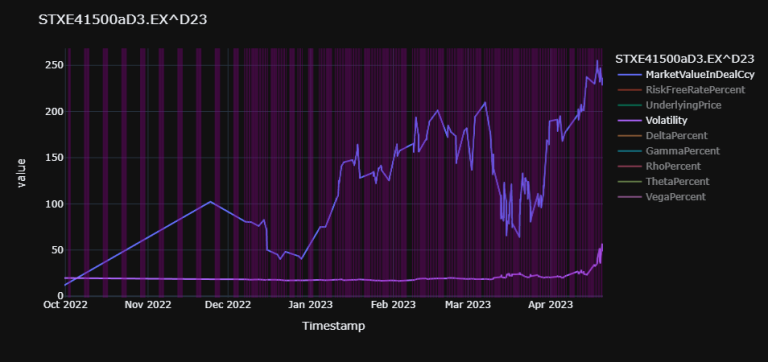
Index Implied Volatility aNd Greeks Instrument Pricing Analytics Calculation (IndxImpVolatNGreeksIPACalc) (IIVNGIPAC) expiered option test:
IIVNGIPAC_exp_optn_test3.instrument: STXE41500aD3.EX^D23
IIVNGIPAC_exp_optn_test3.ATM_opt: STXE41500aD3.EX^D23
IIVNGIPAC_exp_optn_test3.maturity: 2023-04-21 00:00:00
| STXE41500aD3.EX^D23 | MarketValueInDealCcy | RiskFreeRatePercent | UnderlyingPrice | Volatility | DeltaPercent | GammaPercent | RhoPercent | ThetaPercent | VegaPercent | |
|---|---|---|---|---|---|---|---|---|---|---|
| gmt | Romance Summer Time | |||||||||
| 2022-09-30 15:10:00 | 2022-09-30 17:10:00+02:00 | 11.9 | 1.173 | 3321.43 | 19.663222 | 0.059856 | 0.000243 | 1.036283 | -0.127825 | 2.927326 |
| 2022-11-24 09:20:00 | 2022-11-24 11:20:00+02:00 | 102.3 | 1.908 | 3968.03 | 18.368408 | 0.348107 | 0.000791 | 5.172449 | -0.513421 | 9.247155 |
| ... | ... | ... | ... | ... | ... | ... | ... | ... | ... | ... |
| 2023-04-20 08:50:00 | 2023-04-20 10:50:00+02:00 | 229.0 | 3.052 | 4377.74 | 48.463872 | 0.970619 | 0.000535 | 0.13844 | -3.261882 | 0.171266 |
| 2023-04-20 14:10:00 | 2023-04-20 16:10:00+02:00 | 235.8 | 3.052 | 4380.89 | 69.58682 | 0.930349 | 0.000823 | 0.108857 | -10.44042 | 0.311665 |
['ErrorMessage', 'MarketValueInDealCcy', 'RiskFreeRatePercent', 'UnderlyingPrice', 'Volatility', 'DeltaPercent', 'GammaPercent', 'RhoPercent', 'ThetaPercent', 'VegaPercent']

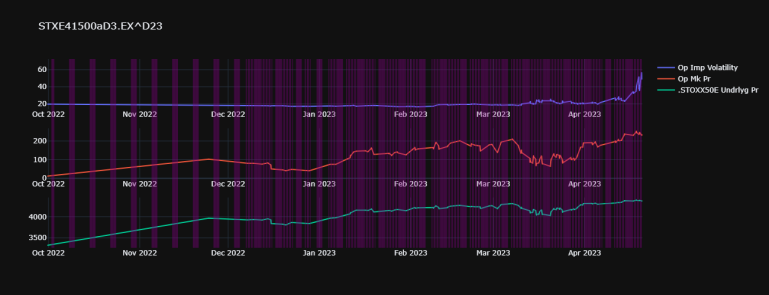
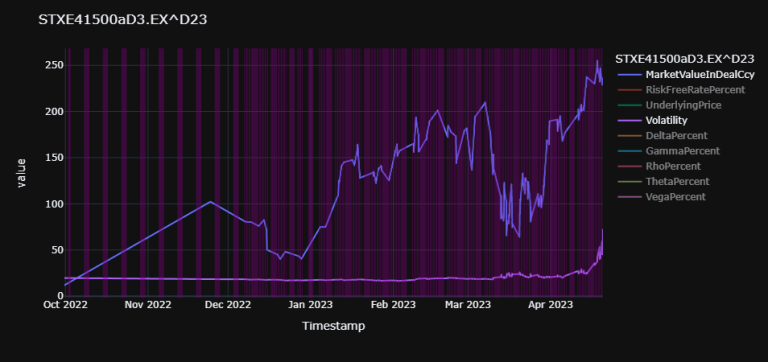
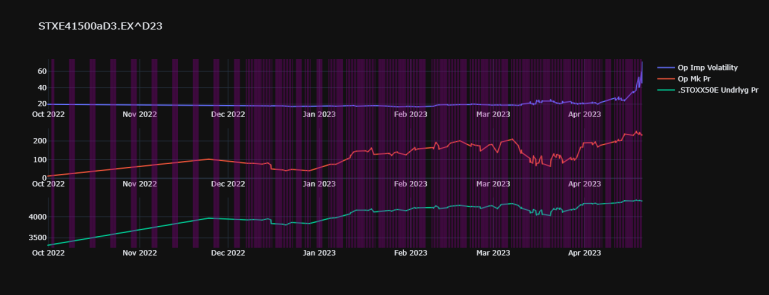
Index Implied Volatility aNd Greeks Instrument Pricing Analytics Calculation (IndxImpVolatNGreeksIPACalc) (IIVNGIPAC) expiered option test At Trade only:
IIVNGIPAC_exp_optn_AT_test3.instrument: STXE41500aD3.EX^D23
IIVNGIPAC_exp_optn_AT_test3.ATM_opt: STXE41500aD3.EX^D23
IIVNGIPAC_exp_optn_AT_test3.maturity: 2023-04-21 00:00:00
| STXE41500aD3.EX^D23 | MarketValueInDealCcy | RiskFreeRatePercent | UnderlyingPrice | Volatility | DeltaPercent | GammaPercent | RhoPercent | ThetaPercent | VegaPercent | |
|---|---|---|---|---|---|---|---|---|---|---|
| gmt | Romance Summer Time | |||||||||
| 2022-09-30 15:10:00 | 2022-09-30 17:10:00+02:00 | 11.9 | 1.173 | 3321.43 | 19.676604 | 0.059823 | 0.000243 | 1.035673 | -0.127868 | 2.92606 |
| 2022-11-24 09:20:00 | 2022-11-24 11:20:00+02:00 | 102.3 | 1.908 | 3968.03 | 18.397388 | 0.347736 | 0.000789 | 5.166494 | -0.514168 | 9.243615 |
| ... | ... | ... | ... | ... | ... | ... | ... | ... | ... | ... |
| 2023-04-20 09:20:00 | 2023-04-20 11:20:00+02:00 | 230.7 | 3.052 | 4380.89 | 45.251846 | 0.980195 | 0.000414 | 0.137612 | -2.190143 | 0.121851 |
| 2023-04-20 14:10:00 | 2023-04-20 16:10:00+02:00 | 235.8 | 3.052 | 4380.89 | 72.055437 | 0.922719 | 0.000861 | 0.10791 | -11.711597 | 0.337491 |

Conclusion
As you can see, not only can we use IPA to gather large amounts of bespoke, calculated, values, but be can also portray this insight in a simple, quick and relevent way!
References
Brilliant: Black-Scholes-Merton
Functions to find Option RICs traded on different exchanges
Making your code faster: Cython and parallel processing in the Jupyter Notebook
What Happens to Options When a Stock Splits?
Select column that has the fewest NA values
Return Column(s) if they Have a certain Percentage of NaN Values (Python)
Related Articles
-
Part 1: Historical Implied Volatility and Greeks of Index Options 'At The Money' On Update and in the Past using Python Type Hints Part 1
-
Equity Derivatives Intraday Analytics: using Python & IPA to gather intraday insights on live and expired derivatives
-
Troubleshooting IPA & RD Python Library
-
Functions to find Option RICs traded on different exchanges
-
Finding Expired Options and Backtesting a Short Iron Condor Strategy
-
Building Search into your Application Workflow
