
Authors:

Dr. Haykaz Aramyan
Developer Advocate
Developer Advocate

Gurpreet Bal
Platform Application Developer
Platform Application Developer

Dr. Marios Skevofylakas
Data Scientist
Data Scientist
Introduction
Financial professionals are often required to analyze and evaluate the costs related to trading financial instruments. Transaction Cost Analysis (TCA) is a tool for doing exactly that by utilizing a variety of§ metrics and benchmarks. Building a TCA system from scratch is a significant undertaking, requiring a deep understanding of financial markets, data analysis, and software development.
In this series of articles, we will break down the complexity of the TCA into stages by implementing a proprietary TCA system. By following the steps provided in the series, you will have a working prototype which can be a backbone for a TCA tool you want to create for your organizations. The series will cover:
We begin by presenting an overview of TCA and its constituents.
We will cover trade enrichment, an integral process that augments trade data with relevant market insights using tick data from LSEG Tick History.
Another crucial focus will be TCA metrics and benchmarks. To that extent, we will provide various performance indicators and benchmarks, offering insights into how trades are executed.
Furthermore, we will explore the area of TCA visualization by implementing Streamlit, enabling us to present TCA data in a more engaging and accessible format.
Section 1. An overview of TCA and its constituents
TCA helps quantify the costs associated with executing investment trades. These costs can significantly impact the profitability and efficiency of trade execution. TCA's main goal is to enable traders to make better informed decisions that could lead to cost minimization and improved execution performance.
TCA examines the "slippage" or "implementation shortfall” between the price at which trades are executed and some benchmark price, often the price available at the time the order is submitted. This difference can be analyzed to understand the various components of transaction costs.
Transaction cost classifications
Slippage
This is the cost of materializing an investment idea. It is calculated as the difference of the returns of a paper traded portfolio, theoretically executed at decision prices, and the actual executed portfolio.
Investment costs
These costs are generated because of delays occurred from investment decision to placing the order in the appropriate venue. Usually, this time is spent in communications between roles and technical delays of placing the order.
Trading costs
These costs are related to the execution strategy profile chosen to materialize the investment. Immediacy can increase or decrease timing risks during execution resulting in favorable or adverse price executions.
Opportunity costs
These costs are the result of not being able to fully execute the investment decision.
In our prototype we concentrate on the Slippage analytics by introducing multiple metrics and benchmarks to power the analysis.
Section 2: Post trading TCA Metrics and Benchmarks
In this section, we provide definitions of the TCA metrics and benchmarks we have used for our prototype.
TCA Metrics
Below are the metrics we have used to compare with the TCA benchmarks to provide insights on the execution performance.
VWAP
Volume weighted average price is used as a proxy of expected market price and is often used to compare strategy execution results and understand if the strategy is over or under performed with regards to the fair market conditions.
TWAP
Time weighted average price is defined as the average price of an instrument within a specific period.
Slippage
This metric is defined as the difference between expected instrument price and executed trade price. Slippage can be positive or negative.
VWAP Slippage
We define as VWAP slippage the difference between market VWAP price and trade executed price.
TCA benchmarks
In addition to the metrics above, we have calculated the following benchmarks, based on the market conditions available at the time the order to trade arrives on the market. The data on the market conditions preceding the order are ingested from the Refinitiv Tick History API, more on which will be discussed in our next article of the series on trades enrichment.
MarketVWAP
This is the reported market VWAP at time the order arrives on the market.
Arrival Price
As an Arrival Price, we use the last trade price available on the market at the time of the order arriving in the order book.
Spread
This is the difference between the best ASK and best BID prices on the market at the time of the order arrival.
High/Low/Mid Prices
These are the high, low, and mid (average of BID and ASK prices) respectively on the market at the time of order arrival.
Section 3: The prototype
Our prototype consists of 3 distinct modules including trades simulation, trades enrichment and transaction cost analysis and visualizations. We will discuss the trades simulation in brief in the scope of the current article and will dedicate separate articles for the other modules.
Meanwhile, the image below gives an idea of the dashboard we will create at the end of the series.
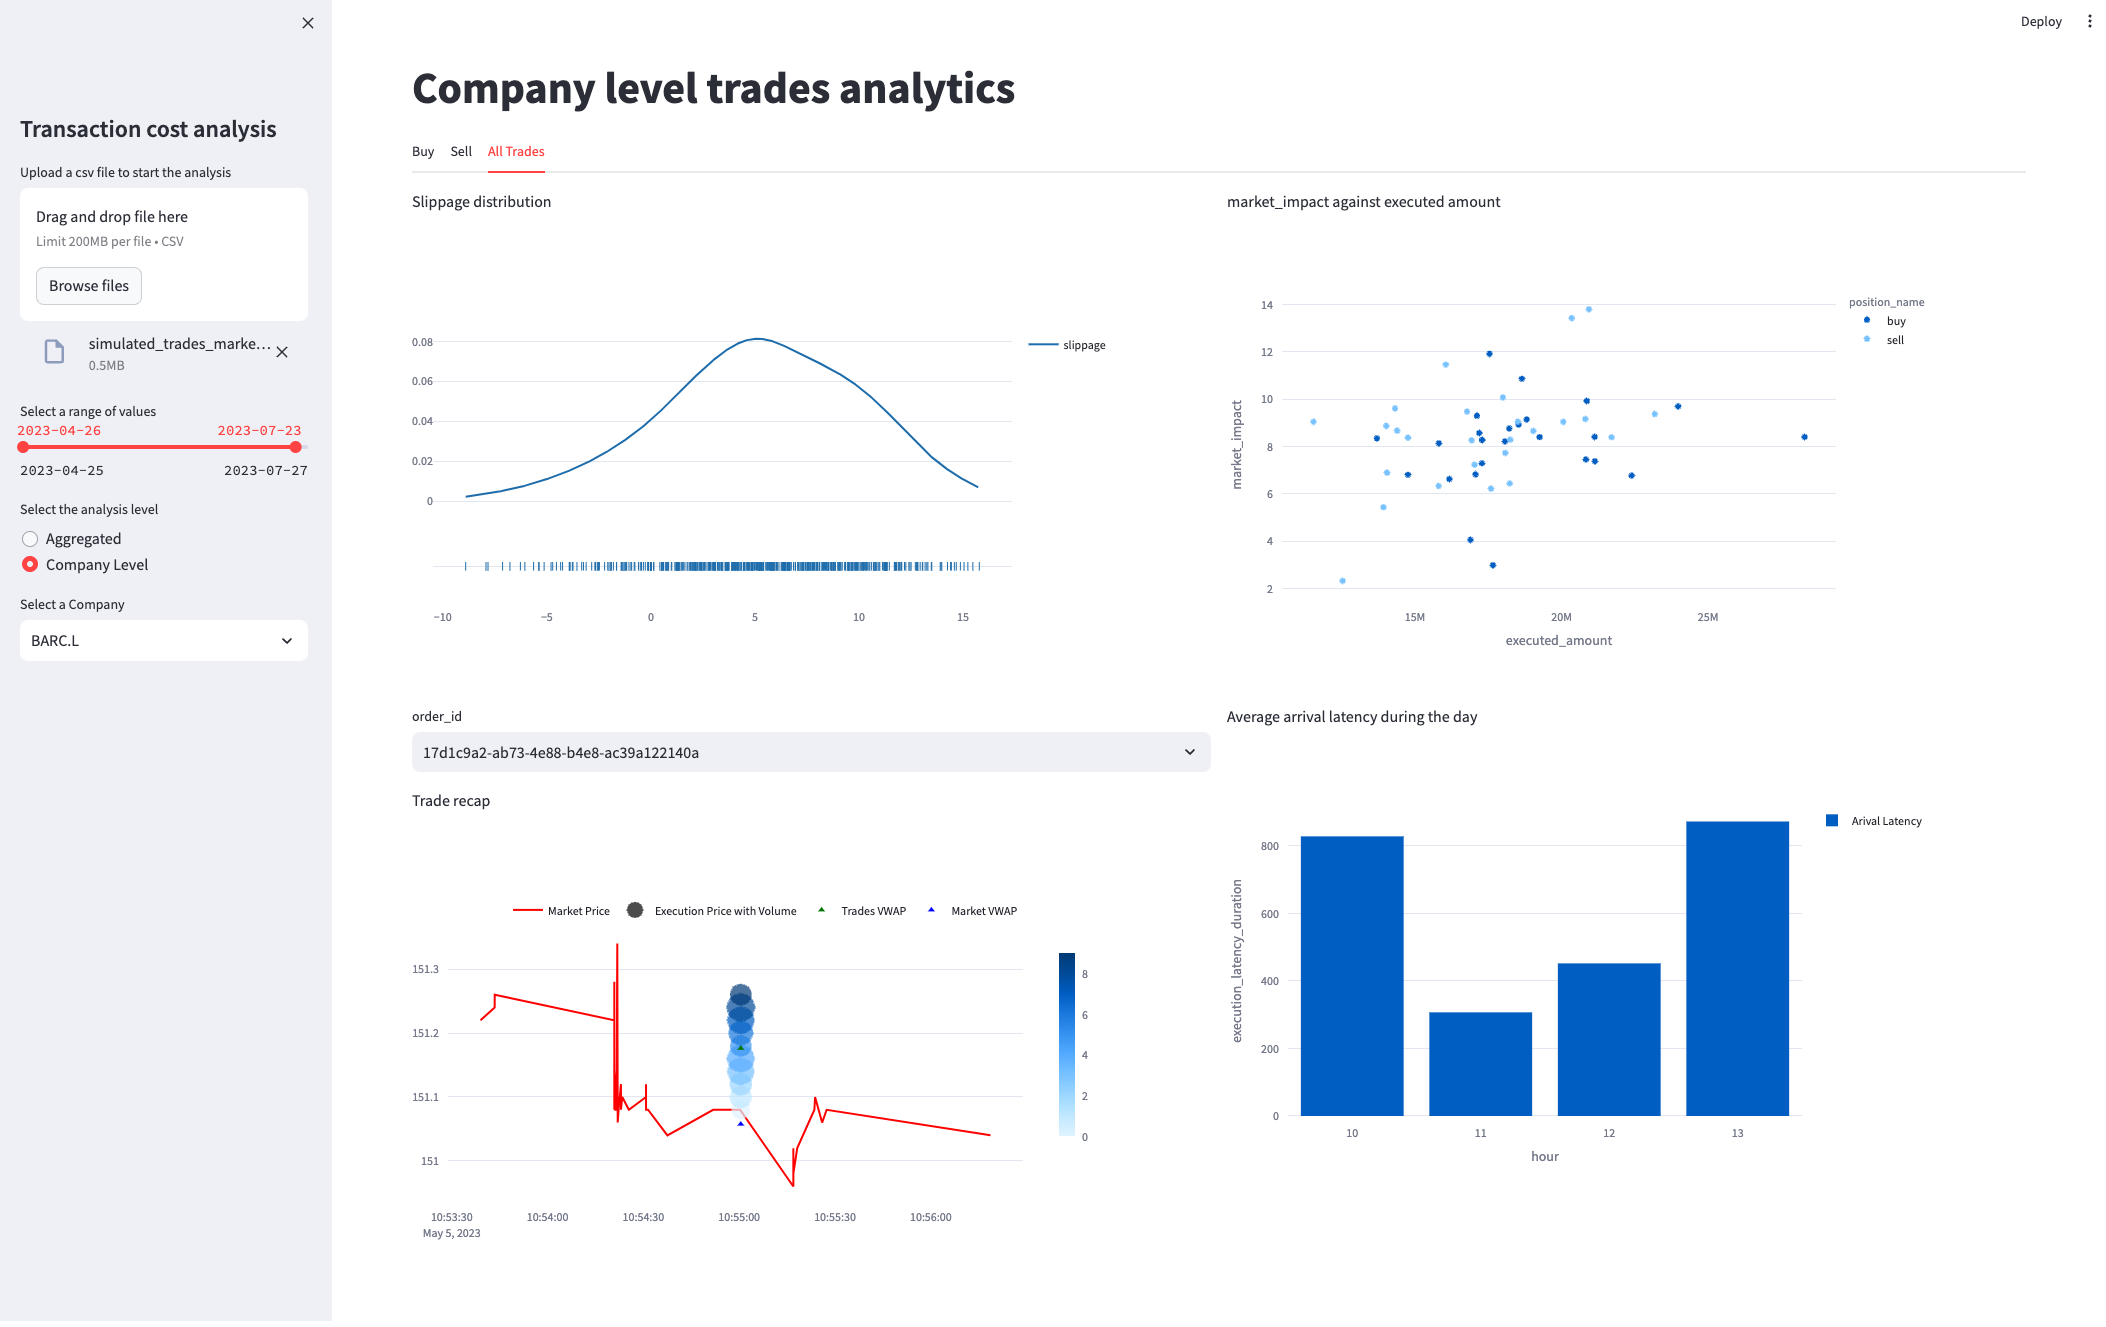
As you can judge from the image above, we will implement summary and company level analytics powered by a wide range of visualization showing the delays, trading costs and how they relate to the defined market benchmarks.
Trades simulation
We expect users of this prototype will submit their own trades for enrichment and analysis. However, for those users interested in the simulation aspect, please check the source code here.
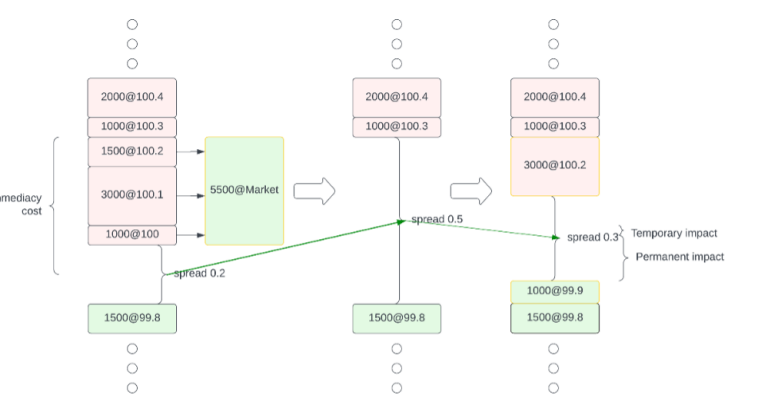
We assume that an investment decision is taken at TDecision,. at time TArrival the order finds itself in the orderbook awaiting execution. While we have implemented limit orders, only market orders were used in the simulation. This way, we can highlight their high immediate cost, also known as market impact. The following graph showcases such a scenario. More about the market impact and its calculation can be found in this article.
The simulation steps are as follows:
- Signal Generation: An investment signal is generated following a simple moving average crossover strategy for several stocks to ensure the diversity of our analysis.
- TDecision to TArrival: We simulate the delay from the investment decision time to the order's arrival time in the orderbook, by adding a 100ms lag.
- Orderbook Data Retrieval: Post TArrival, we collect 15 seconds of 10 levels of orderbook data using LSEG Tick History API.
- Price Matching: Within the 15-second window, we identify the tick closest to the arrival price for our execution reference.
- Execution Strategy: We then execute a market order to buy or sell a set volume of shares.
- Simulation Details: Simulated broker and trader IDs are assigned to each transaction, mirroring the detail found in real trading logs.
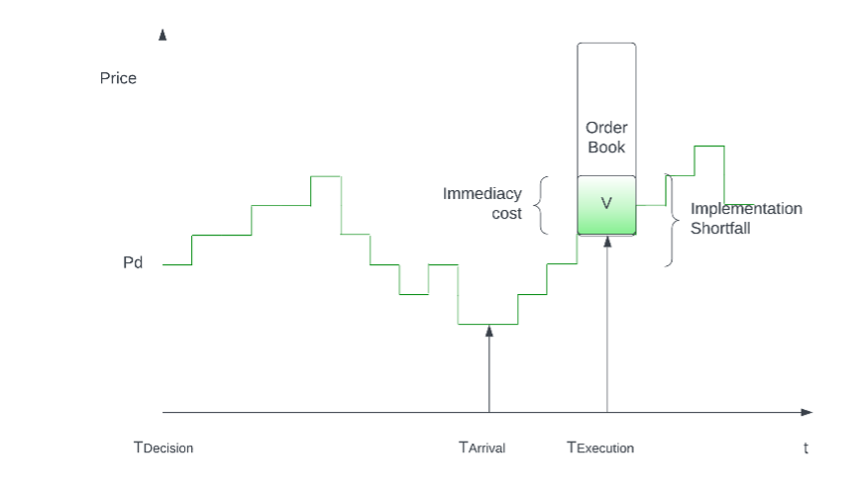
The following graph depicts all the stages of such an execution sequence and the costs incurred at each stage.
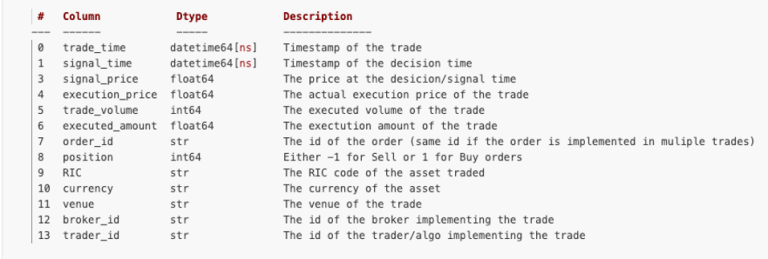
The trades schema that users should provide to the prototype looks as follows:
To use some proprietary schema, some changes will need to be made in the project modules.
Trades Enrichment
In this module, we asynchronously extract tick level trade data 1 minute before the first execution and 1 minute after the last execution of our order, for each of our orders across the assets. Check the details of the implementation in the second article of the series here.
TCA visualizations
The visualization module implements the presentation layer of the actual analysis, as a presentation framework we use Streamlit which provides a more interactive and accessible way for the user to interact with the TCA results. The third and the final article of the series discusses the implementation of this module and provides an interactive dashboard to demonstrate the results of the analyis.
Conclusion
This article touched on the theory behind TCA, outlining the various costs and their components. Moreover, we've shown how trades can affect the market and illustrated what an execution strategy involving the market order book looks like through visual graphs.
Additionally, the article has presented the structure of the modules we've developed in this prototype, particularly emphasizing in the trade simulation module. This establishes a solid base for the upcoming articles on trades enrichment and TCA visualization modules. Stay tuned for these next articles, which will further explore the application of TCA to enhance trading strategies and feel free to reach out to us with any questions through our LSEG Developer portal Q&A.
- Register or Log in to applaud this article
- Let the author know how much this article helped you
If you require assistance, please
contact us here
Get In Touch
Source Code
Related Videos
RELATED ARTICLES
Related APIs
Request Free Trial
Call your local sales team
Americas
All countries (toll free): +1 800 427 7570
Brazil: +55 11 47009629
Argentina: +54 11 53546700
Chile: +56 2 24838932
Mexico: +52 55 80005740
Colombia: +57 1 4419404
Europe, Middle East, Africa
Europe: +442045302020
Africa: +27 11 775 3188
Middle East & North Africa: 800035704182
Asia Pacific (Sub-Regional)
Australia & Pacific Islands: +612 8066 2494
China mainland: +86 10 6627 1095
Hong Kong & Macau: +852 3077 5499
India, Bangladesh, Nepal, Maldives & Sri Lanka:
+91 22 6180 7525
Indonesia: +622150960350
Japan: +813 6743 6515
Korea: +822 3478 4303
Malaysia & Brunei: +603 7 724 0502
New Zealand: +64 9913 6203
Philippines: 180 089 094 050 (Globe) or
180 014 410 639 (PLDT)
Singapore and all non-listed ASEAN Countries:
+65 6415 5484
Taiwan: +886 2 7734 4677
Thailand & Laos: +662 844 9576