Author:

Updated: 14 Feb 2025
For the Python programming language, Pandas is an efficient and popular data analysis tool, especially its Dataframe, used to manipulate and display data. For the .NET programming languages, we can use Deedle or Microsoft.Data.Analysis package available in Nuget which also provides a DataFrame class used to manipulate, transform, and display data.
This example focuses on Microsoft.Data.Analysis package by demonstrating some basic features of the DataFrame class in Jupyter Notebook. .
It also uses the Plotly.NET Interactive package which is a .NET interactive kernel extension for displaying Plotly.NET charts to plot charts for the data in the Dataframe.
Prerequisite
To run examples in this article, please refer to this Using .NET on Jupyter Notebook or JupyterLab article for setting up Jupyter Notebook or Jupyter Lab to support the .NET programming languages
Install the package
All required packages are available on NuGet or the dotnet-interactive #r magic command can be used to install the following packages from NuGet.
- Microsoft.Data.Analysis 0.22.1
- Plotly.NET.Interactive 5.0.0
- Microsoft.DotNet.Interactive.Formatting 1.0.0-beta.25070.1
#r "nuget:Microsoft.Data.Analysis,0.22.1"
#r "nuget: Plotly.NET.Interactive, 5.0.0"
#r "nuget: Microsoft.DotNet.Interactive.Formatting, 1.0.0-beta.25070.1"
Using the namespaces
This article uses classes from the following four packages. Therefore, it uses the using statement to refer to those packages.
- Plotly.NET: plotly.js charts in .NET programming languages
- Microsoft.Data.Analysis: An easy-to-use and high-performance libraries for data analysis and transformation
- System.Linq: Classes and interfaces that support queries that use Language-Integrated Query
- Microsoft.DotNet.Interactive.Formatting: Convention-based and highly configurable .NET object formatting for interactive programming
- System.Text: StringBuilder
using Plotly.NET;
using static Plotly.NET.StyleParam;
using Plotly.NET.TraceObjects;
using Microsoft.Data.Analysis;
using System.Linq;
using Microsoft.DotNet.Interactive.Formatting;
using System.Text;
Render a DataFrame as an HTML table
A DataFrame is rendered as an HTML table.
However, the DataFrameRow and DataFrameColumn aren't rendered as a proper HTML table.
This can be overridden by registering the custom formatter for the DataFrameRow and DataFrameColumn. The below code registers custom formatters for the DataFrameRow and DataFrameColumn to render the data in an HTML table.
Formatter.Register<DataFrameRow>(rows =>
{
StringBuilder sb = new StringBuilder("<table><tr>");
foreach(var r in rows){
sb.Append($"<td>{r}</td>");
}
sb.Append("</tr></table>");
return sb.ToString();
},
mimeType: "text/html");
Formatter.Register<DataFrameColumn>(cols =>
{
StringBuilder sb = new StringBuilder("<table><tr>");
sb.Append($"<th><b>{cols.Name}</b></th></tr>");
foreach(var c in cols){
sb.Append($"<tr><td>{c}</td></tr>");
}
sb.Append("</table>");
return sb.ToString();
},
mimeType: "text/html");
Create the DataFrame
DataFrameColumn
A DataFrame can be created by passing the list of DataFrameColumn objects to the DataFrame's constructor.
| public DataFrame(params DataFrameColumn[] columns); public DataFrame(IEnumerable<DataFrameColumn> columns); |
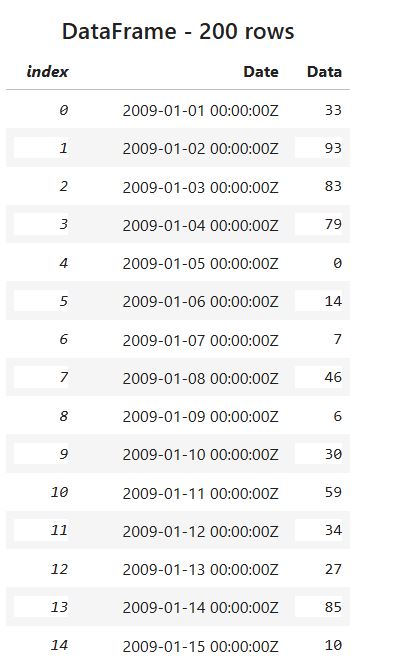
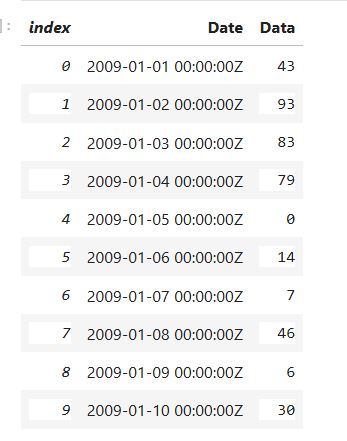
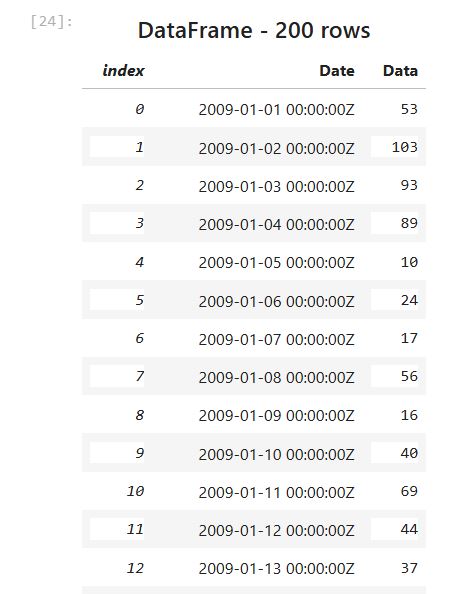
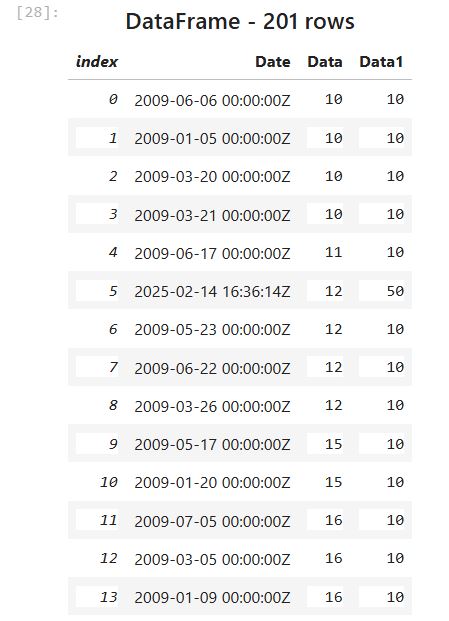
The following code creates a DataFrame that has 200 rows and 2 columns. The first column contains dates and the second column contains random integer numbers. It calls the PrimitiveDataFrameColumn constructor to create the DataFrameColumn instances.
var start = new DateTime(2009,1,1);
Random rand = new Random();
var numDataPoint = 200;
PrimitiveDataFrameColumn<DateTime> date = new PrimitiveDataFrameColumn<DateTime>("Date",
Enumerable.Range(0, numDataPoint)
.Select(offset => start.AddDays(offset))
.ToList());
PrimitiveDataFrameColumn<int> data = new PrimitiveDataFrameColumn<int>("Data",
Enumerable.Range(0, numDataPoint)
.Select(r => rand.Next(100))
.ToList());
var df = new DataFrame(date, data);
df
CSV File
The DataFrame can also be created from a CSV file by calling the DataFrame.LoadCsv static method.
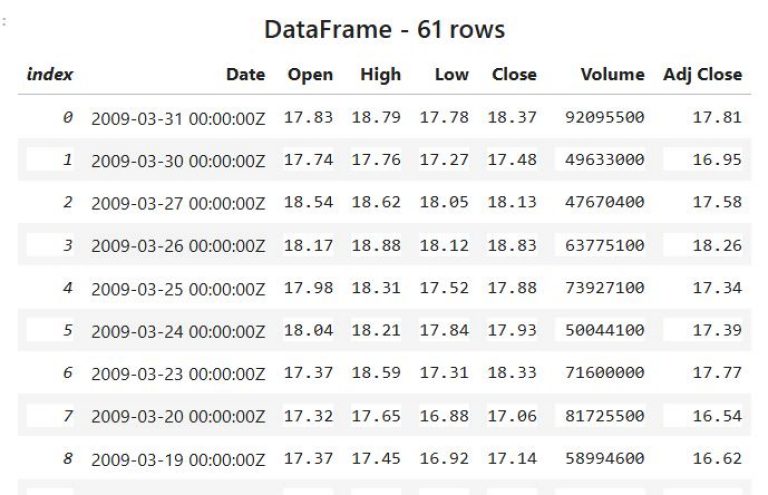
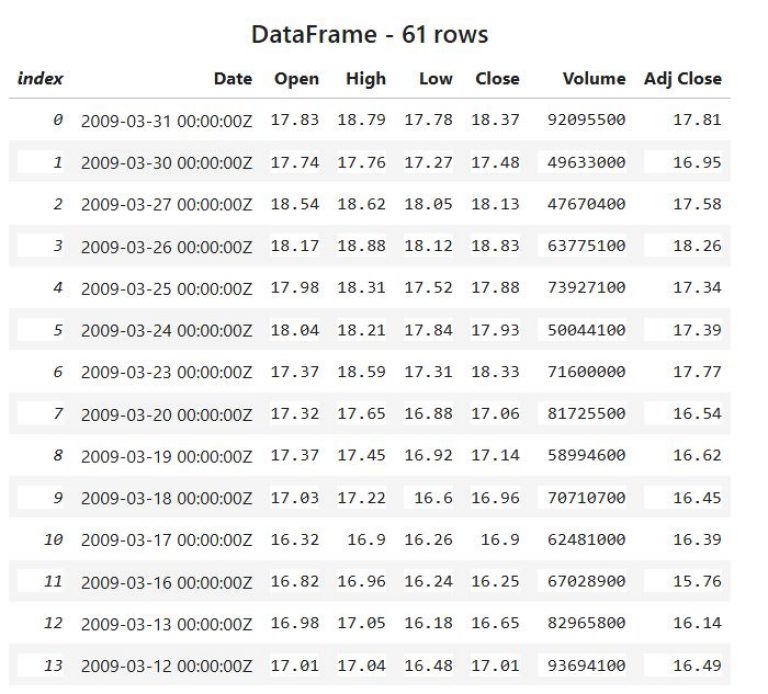
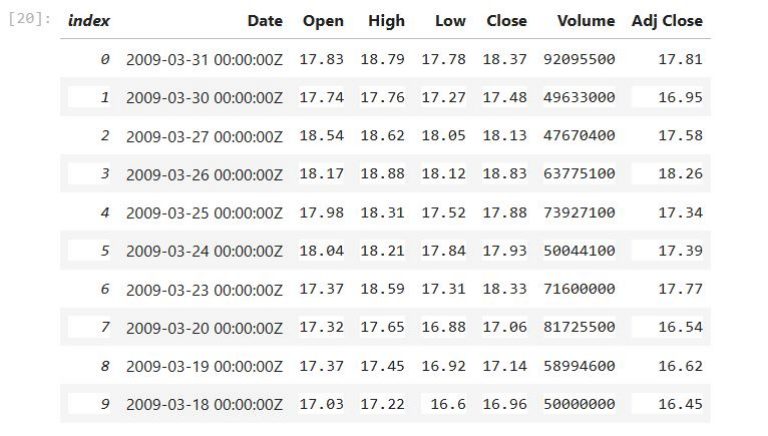
The following code creates a DataFrame from the ohcldata.csv file. This file is downloaded from 5.30. Example - Basic OHLC (Open, High, Low, Close) Financial Plot website. This file contains the daily Open, High, Low, Close financial data.
var df1 = DataFrame.LoadCsv("ohlcdata.csv");
df1
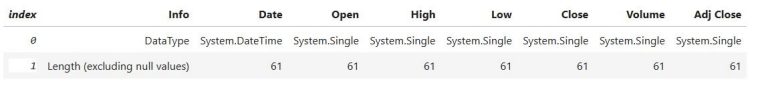
Then, the Info method can be used to generate a summary of each column in the DataFrame.
df1.Info()
df[0,1]
After that, a new value can be assigned to the DataFrame.
The below code increases the data in the first row and the second column by 10.
df[0,1] = int.Parse(df[0,1].ToString()) + 10;
df.Head(10)
df1.Rows[9]

The column index can also be used to access the specific column in the row.
The below accesses the fourth column in the tenth row.
df1.Rows[9][5]

Then, the new value can also be assigned to the column.
The below code assigns 50000000 to the sixth column.
df1.Rows[9][5] = 50000000f;
df1.Head(10)
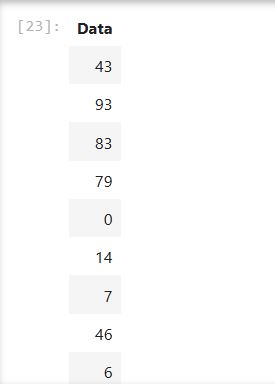
//df.Columns["Data"] or df.Columns[1]
df.Columns["Data"]
The data in the column can be changed by using the DataFrame's overloaded operators.
The below code increases all data in the column by ten.
df.Columns["Data"]= df.Columns["Data"]+10;
df
df.Columns.Add(new PrimitiveDataFrameColumn<int>("Data1", df.Rows.Count()));
df
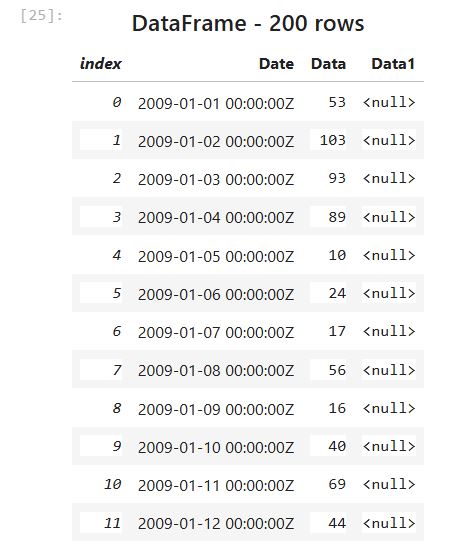
The data in the new column is set to null.
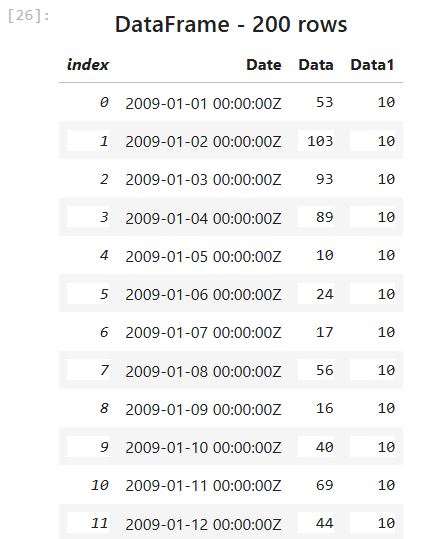
The following code fills null values in the new column (Data1) with 10.
df.Columns["Data1"].FillNulls(10, true);
df
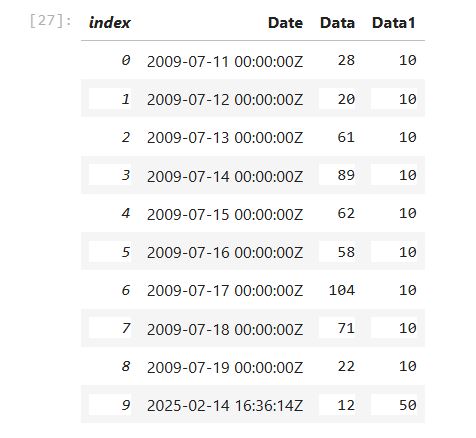
df.Append(new List<KeyValuePair<string, object>>() {
new KeyValuePair<string, object>("Date", DateTime.Now),
new KeyValuePair<string, object>("Data", 12),
new KeyValuePair<string, object>("Data1", 50)
}, true);
df.Tail(10)
df.OrderBy("Data")
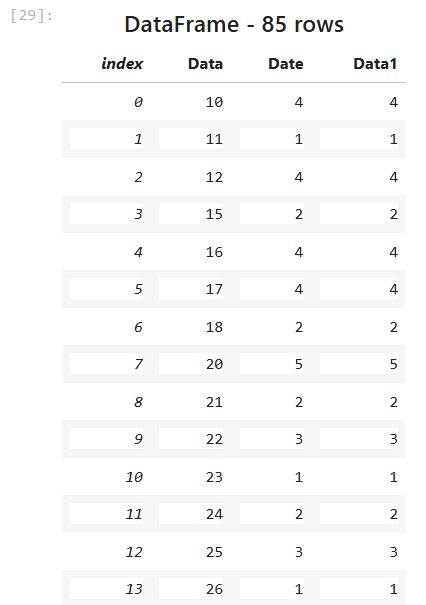
var groupByData = df.GroupBy("Data");
groupByData.Count().OrderBy("Data")
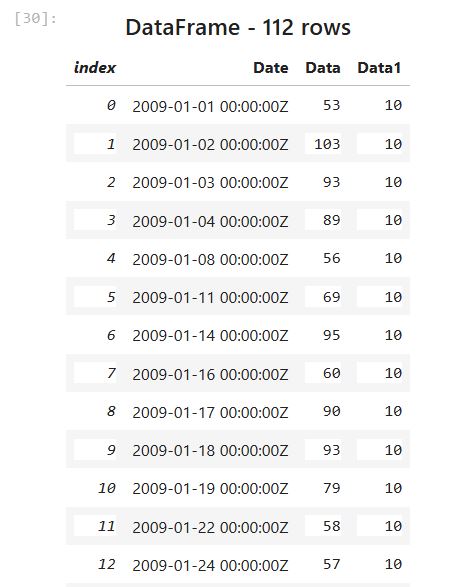
df.Filter(df.Columns["Data"].ElementwiseGreaterThan(50))
Merge the DataFrame
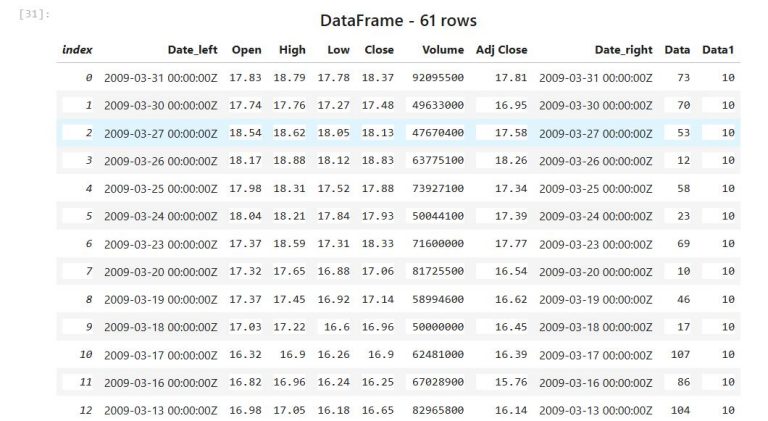
The Merge method can be used to merge two DataFrames with a database-style join.
The following code joins two DataFrames by using the Date column contained in both DataFrames. First, it converts the data type in the Date column of the df1 from the string type to the DataTime type. Then, it calls the Merge method to join the DataFrames.
var dateformat = "M/d/yyyy hh:mm:ss tt";
df1.Columns["Date"] = new PrimitiveDataFrameColumn<DateTime>("Date",
df1.Columns["Date"]
.Cast<object>()
.ToList()
.Select(x => DateTime.ParseExact(x.ToString(), dateformat, System.Globalization.CultureInfo.InvariantCulture))
.Cast<DateTime>());
df1.Merge<DateTime>(df, "Date", "Date")
Plot charts by using Plotly.NET
Plotly.NET provides functions for generating and rendering plotly.js charts in .NET programming languages. It is based on Plotly which is the popular JavaScript charting library.
The following examples demonstrate how to use Plotly.NET to plot charts by using the data in the DataFrame.
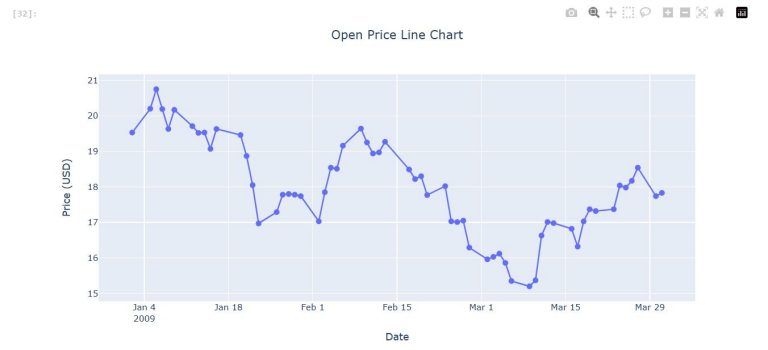
Line chart
The following code plots a line chart from the Open column in the DataFrame.
Title title = Title.init(X:0.5, Text: "Open Price Line Chart");
var dateData = df1.Columns["Date"].Cast<DateTime>().ToArray();
var openData = df1.Columns["Open"].Cast<Single>().ToArray();
var chart1 = Chart2D.Chart.Line<DateTime, Single, bool>(dateData, openData, true)
.WithSize(1000, 500)
.WithMarker(Marker.init(Size: 8))
.WithXAxisStyle(title: Title.init(Text:"Date"))
.WithYAxisStyle(title: Title.init(Text:"Price (USD)"))
.WithLayout(Layout.init<bool>(Title: title));
chart1
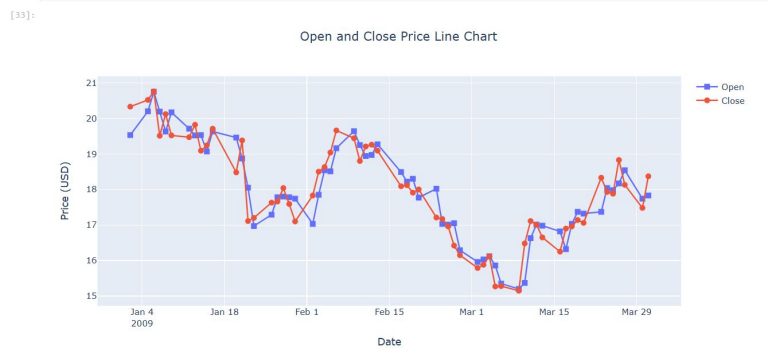
Line Chart with Mulitple Lines
The following code plots the Open, and Close columns in a line chart.
Title title = Title.init(X:0.5, Text: "Open and Close Price Line Chart");
var dateData = df1.Columns["Date"].Cast<DateTime>().ToArray();
var openData = df1.Columns["Open"].Cast<Single>().ToArray();
var closeData = df1.Columns["Close"].Cast<Single>();
var multiChart = Chart.Combine(new [] {
Chart2D.Chart.Line<DateTime, Single, bool>(dateData, openData,true,Name: "Open")
.WithMarkerStyle(Symbol: StyleParam.MarkerSymbol.Square),
Chart2D.Chart.Line<DateTime, Single, bool>(dateData, closeData, true, Name: "Close")
}).WithSize(1000, 500)
.WithMarker(Marker.init(Size: 8))
.WithXAxisStyle(title: Title.init(Text:"Date"))
.WithYAxisStyle(title: Title.init(Text:"Price (USD)"))
.WithLayout(Layout.init<bool>(Title: title));
multiChart
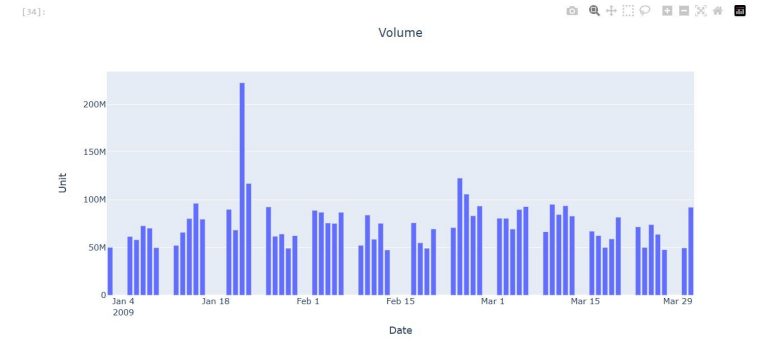
Title title = Title.init(X:0.5, Text: "Volume");
var dateData = df1.Columns["Date"].Cast<DateTime>().ToArray();
var volumeData = df1.Columns["Volume"].Cast<Single>().ToArray();
var columnChart = Chart2D.Chart.Column<Single, DateTime, bool, bool, bool>(volumeData, dateData)
.WithSize(1000, 500)
.WithXAxisStyle(title: Title.init(Text:"Date"))
.WithYAxisStyle(title: Title.init(Text:"Unit"))
.WithLayout(Layout.init<bool>(Title: title));
columnChart
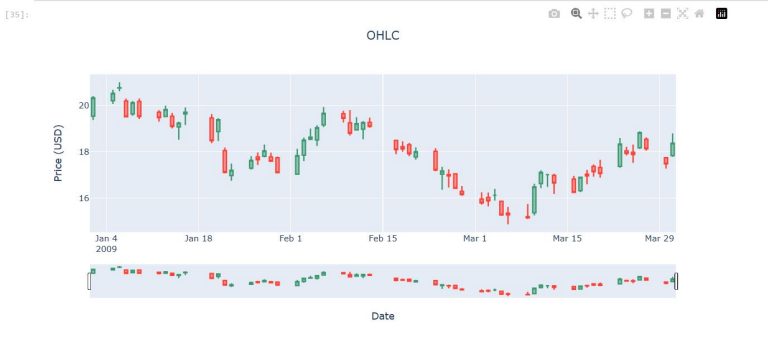
Title title = Title.init(X:0.5, Text: "OHLC");
var dateData = df1.Columns["Date"].Cast<DateTime>().ToArray();
var openData = df1.Columns["Open"].Cast<Single>().ToArray();
var highData = df1.Columns["High"].Cast<Single>().ToArray();
var lowData = df1.Columns["Low"].Cast<Single>().ToArray();
var closeData = df1.Columns["Close"].Cast<Single>().ToArray();
var candleChart = Chart2D.Chart.Candlestick<Single, Single, Single, Single, DateTime, bool>(openData, highData, lowData, closeData, X:dateData)
.WithSize(1000, 500)
.WithXAxisStyle(title: Title.init(Text:"Date"))
.WithYAxisStyle(title: Title.init(Text:"Price (USD)"))
.WithLayout(Layout.init<bool>(Title: title));
candleChart
References
- Phplot.sourceforge.net. n.d. 5.30. Example - Basic OHLC (Open, High, Low, Close) Financial Plot. [online] Available at: http://phplot.sourceforge.net/phplotdocs/ex-ohlcbasic.html [Accessed 6 May 2021].
- Bluemountaincapital.github.io. n.d. Deedle: Exploratory data library for .NET. [online] Available at: https://bluemountaincapital.github.io/Deedle/ [Accessed 6 May 2021].
- Govindarajan, P., 2019. An Introduction to DataFrame | .NET Blog. [online] .NET Blog. Available at: https://devblogs.microsoft.com/dotnet/an-introduction-to-dataframe/ [Accessed 6 May 2021].
- Sequeira, J., 2020. dotnet/interactive: Magic Commands. [online] GitHub. Available at: https://github.com/dotnet/interactive/blob/main/docs/magic-commands.md [Accessed 6 May 2021].
- Winnington, E., 2019. Eric Winnington - Tips and tricks for C# Jupyter notebook. [online] Ewinnington.github.io. Available at: https://ewinnington.github.io/posts/jupyter-tips-csharp [Accessed 6 May 2021].
- (No date) Plotly C# graphing library in Csharp. Available at: https://plotly.com/csharp/ (Accessed: 14 February 2025).
- Phuriphanvichai, J., 2021. Using .NET on Jupyter Notebook or JupyterLab | LSEG Developers. [online] Developers.lseg.com. Available at: https://developers.lseg.com/en/article-catalog/article/using--net-core-in-jupyter-notebook [Accessed 10 May 2021].