Authors:

Last Updated: August 2025
Overview
In this article, we explore the process of building historical constituents of a market index, underscoring its importance for investors, researchers, and various participants in the financial markets. This data is critical for back-testing investment strategies, tracking shifts across industry sectors over time and for many other financial domains.
While identifying the current members of an index is straightforward, uncovering this information for previous periods sometimes presents significant challenges. Indexes are subject to frequent changes due to regular rebalancing, mergers, acquisitions, and delistings. Thus, those interested in historical data must navigate these changes to maintain the accuracy of their analyses. LSEG provides access to historical index constituents through its APIs, yet there isn't a simple, single AI call to retrieve the constituents historically. Users faced with the task either call the index constituent function multiple times in a loop (which results numerous API calls and is not a suugested workflow) or have to reconstruct the constituent lists manually based on the response received from the Joiner/Leaver capabilities of the API.
This article aims to streamline this process. We will introduce a series of functions designed to simplify access to historical index data, allowing users to retrieve this information through a single API request. By automating the management of index rebalancing over the change dates, we alleviate the burden on users, enabling them to focus on their analytical and investment strategies without getting entangled in the complexities of data retrieval.
In addition to the series of functions we explore in this article, we have encapsulated them within a singleton Python object, offering a unified interface for their invocation. This object is accessible in the source folder on GitHub.
Install and import packages
To start, we first install and import the necessary packages. We use the LSEG Data Libraries API to retrieve the data. The code is built using Python 3.12. Other prerequisite packages are installed as shown below:
#!pip install lseg-data
#!pip install pandas
#!pip install plotly
import lseg.data as ld
import pandas as pd
import copy
import plotly.express as px
Opening the session
To use the API, we first need to authorize ourselves and open either a desktop or a platform session. In the scope of this article, we will be connected through a desktop session for which a Workspace app running in the background is required. More on the configuration of LD libraries can be found here.
ld.open_session()
Defining Helper functions
In this section, we will define and explain the helper functions which are further wrapped into a separate function allowing to get the historical constituents of a given index through a single function call. Although it is not expected from users to run thesee helper functions separatly, we will run those under this section to familiarize ourselves on the output of each of the helper functions.
First let's define the index and the required date range below. In the scope of this article, we use FTSE 100 index (.FTSE) for the period between 2014-01-01 and 2024-03-31.
ric = '.FTSE'
start = '2014-01-01'
end = '2024-02-15'
Getting the initial list of constituents as of a date
The first step in or workflow is to get the list of index constituents as of the requested start date. This will provide us with an initial constituent list which we will update in our subsequent steps.
def get_constituents_as_of(ric, date):
initial_constituents = ld.get_data(universe=[f"0#{ric}({date.replace('-', '')})"],
fields=["TR.PriceClose"],
parameters={"SDATE":f"{date}", "EDATE":f"{date}"}
)
initial_constituents = initial_constituents['Instrument'].to_list()
return initial_constituents
The function accepts the ric of an index and a date as an input and returns the list of index constituents using get_data function of LD Libraries.
initial_constituents = get_constituents_as_of(ric, start)
print(initial_constituents, len(initial_constituents))
['ABF.L', 'SAB.L^J16', 'ABDN.L', 'ADN.L^H17', 'ADML.L', 'AGGK.L^H21', 'AMFW.L^J17', 'AAL.L', 'ANTO.L', 'AHT.L', 'AZN.L', 'AV.L', 'BAB.L', 'BAES.L', 'BARC.L', 'RRS.L^A19', 'BG.L^B16', 'BHPB.L^A22', 'BP.L', 'BATS.L', 'BLND.L', 'BT.L', 'BNZL.L', 'BRBY.L', 'CPI.L', 'CCL.L', 'CNA.L', 'CCH.L', 'CPG.L', 'CRH.L', 'DGE.L', 'EZJ.L', 'EXPN.L', 'FERG.L', 'FRAS.L', 'FRES.L', 'FLG.L^D15', 'GFS.L^E21', 'GKN.L^E18', 'GLEN.L', 'GSK.L', 'HMSO.L', 'HRGV.L', 'HSBA.L', 'ICAG.L', 'IMI.L', 'IMB.L', 'IHG.L', 'ITRK.L', 'IDSI.L', 'ITV.L', 'JMAT.L', 'KGF.L', 'LAND.L', 'LGEN.L', 'LLOY.L', 'LSEG.L', 'MKS.L', 'MGGT.L^I22', 'MRON.L', 'MNDI.L', 'NG.L', 'NWG.L', 'NXT.L', 'OMU.L', 'PSON.L', 'PSN.L', 'PFC.L', 'PRU.L', 'RKT.L', 'REL.L', 'REX.L^G16', 'RIO.L', 'RR.L', 'RSA.L^F21', 'SGE.L', 'SBRY.L', 'SDR.L', 'SVT.L', 'SHEL.L', 'RDSb.L^A22', 'SHP.L^A19', 'SKYB.L^K18', 'SN.L', 'SMIN.L', 'SSE.L', 'STAN.L', 'ARM.L^I16', 'TATE.L', 'TSCO.L', 'TPK.L', 'TT.L^L14', 'TLW.L', 'ULVR.L', 'UU.L', 'VOD.L', 'WEIR.L', 'WTB.L', 'WMH.L^D21', 'MRW.L^J21', 'WPP.L'] 101
Getting the Joiners and Leavers during the requested period
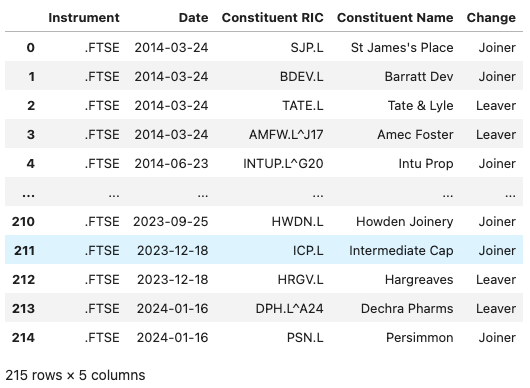
The following function wrapping the get_data function from LD Libraries with respective TR.IndexJL fields returns a dataframe containing both index Joiners and Leavers for the requested date range.
def get_constituent_changes(ric, start, end):
const_changes = ld.get_data(universe=[ric],
fields = ["TR.IndexJLConstituentChangeDate", "TR.IndexJLConstituentRIC",
"TR.IndexJLConstituentName", "TR.IndexJLConstituentituentChange"],
parameters={"SDATE":f"{start}","EDATE":f"{end}", 'IC':'B'}
)
return const_changes
constituent_changes = get_constituent_changes(ric, start, end)
constituent_changes

Updating index constituents with Joiners and Leavers
Before we introduce the function that updates the index constituents, we first outline the "add_joiner" and "remove_leaver" helper functions. These functions take an initial list and a specified list of joiners or leavers, and then return an updated list. Additionally, they check to ensure the joiner isn't already included in the initial list and that the leaver hasn't been mistakenly retained. This step is crucial for identifying any discrepancies in the data, allowing for necessary adjustments to the scripts.
def add_joiner(init_list, joiner_list):
for joiner in joiner_list:
if joiner not in init_list:
init_list.append(joiner)
else:
print(f'{joiner} joiner is already in the list')
return init_list
def remove_leaver(init_list, leaver_list):
for leaver in leaver_list:
if leaver in init_list:
init_list.remove(leaver)
else:
print(f'{leaver} leaver is not in the list')
return init_list
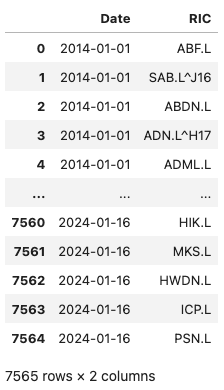
The following update_constituents function is designed to track changes in the composition of an index's constituents over time. It begins by creating a dataframe with the initial list of constituents. It then processes changes to the index on each change date identified in constitent_changes dataframe. For each date, it isolates the changes, distinguishing between 'Joiner' and 'Leaver'. It also ensures that any entity listed as both a joiner and a leaver on the same date is treated uniquely by creating two separate lists: one for unique joiners and one for unique leavers. If there are any unique joiners, they are added to the index constituents; similarly, any unique leavers are removed. After applying these changes a dataframe with new constituents is created and added to the historical constituents dataframe. The function ultimately returns a dataframe containing change dates and corresponding index constituents as of that day, allowing for a comprehensive view of the index's evolution over time.
def update_constituents(start, constituents, constitent_changes):
hist_constituents = pd.DataFrame([(start, ric) for ric in constituents], columns=['Date', 'RIC'])
for date in constitent_changes['Date'].unique():
const_changes_date = constitent_changes[constitent_changes['Date'] == date]
joiners = const_changes_date[const_changes_date['Change']=='Joiner']['Constituent RIC'].to_list()
leavers = const_changes_date[const_changes_date['Change']=='Leaver']['Constituent RIC'].to_list()
joiners_unique = list(set(joiners) - set(leavers))
leavers_unique = list(set(leavers) - set(joiners))
if len(joiners_unique) > 0:
constituents = add_joiner(constituents, joiners_unique)
if len(leavers_unique) > 0:
constituents = remove_leaver(constituents, leavers_unique)
new_constituents = copy.deepcopy(constituents)
new_constituents_df = pd.DataFrame([(str(date)[:10], ric) for ric in new_constituents], columns=['Date', 'RIC'])
hist_constituents = pd.concat([hist_constituents, new_constituents_df])
hist_constituents = hist_constituents.reset_index(drop = True)
return hist_constituents
historical_constituents = update_constituents(start, initial_constituents, constituent_changes)
historical_constituents
Wrapping all together
We encapsulate the previously discussed functions into a single, comprehensive function named get_historical_constituents. This function efficiently returns a DataFrame containing the historical constituents, leveraging the functionality of the aforementioned methods. Additionally, we wrapped this function within a singleton object accessible in GitHub folder of the project.
def get_historical_constituents(index, start, end):
initial_constituents = get_constutents_as_of(index, start)
constitent_changes = get_constituent_changes(index, start, end)
historical_constituents = update_constituents(start, initial_constituents, constitent_changes)
return historical_constituents
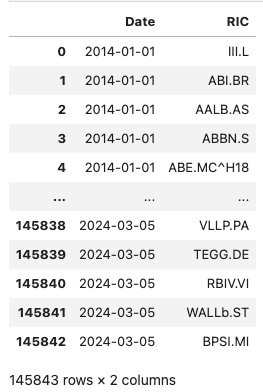
Finnaly, let's use this function to get constituents of several indexes via a single function call.
ftse_constituents = get_historical_constituents('.FTSE', '2014-01-01', '2024-03-14')
ftse_constituents

spx_constituents = get_historical_constituents('.SPX', '2014-01-01', '2024-03-14')
spx_constituents

stoxx_constituents = get_historical_constituents('.STOXX', '2014-01-01', '2024-03-14')
stoxx_constituents
Show sectoral distribution over time
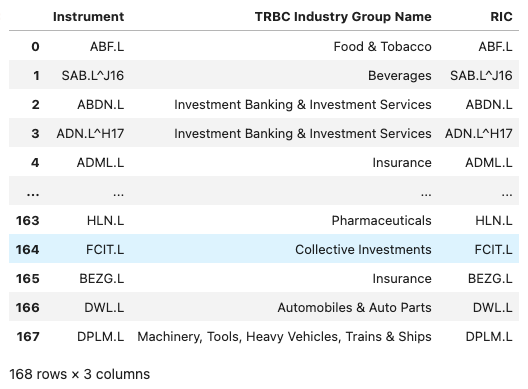
Given our straightforward method for accessing the historical constituents of an index, let's delve into a use case: examining the historical sectoral distribution within an index. This analysis can serve as an effective proxy for understanding the broader economic trends of a country. To begin, we will first identify the sectors represented by the constituents of the index.
sectors = ld.get_data(list(ftse_constituents['RIC'].unique()), ["TR.TRBCIndustryGroup", "TR.RIC"])
sectors
Next, we merge the sectoral information with our original dataframe of historical index constituents and group by the date and the industry.
sector_df = ftse_constituents.merge(sectors, on = 'RIC')
sector_df_grouped = sector_df.groupby(by = ["Date", "TRBC Industry Group Name"]).count()
sector_df_grouped = sector_df_grouped.reset_index()
sector_df_grouped
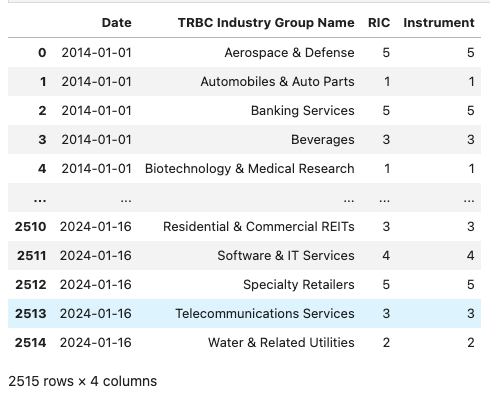
Finally, we define the sectors we are interested in to zoom into and produce a plotly bar chart with sectoral distribution over time.
_sectors = ["Software & IT Services", "Banking Services", "Telecommunications Services", "Automobiles & Auto Parts", "Aerospace & Defense"]
fig = px.bar(sector_df_grouped[sector_df_grouped['TRBC Industry Group Name'].isin(_sectors)], x="Date", y="Instrument", color="TRBC Industry Group Name", width=1000, height=400)
fig.update_layout(
xaxis=dict(
type='category',
categoryorder='array',
)
)
fig.show()

Conclusion
Throughout our exploration, we've established a straightforward approach for retrieving historical constituents of a market index, which is invaluable for investors aiming to back-test strategies. By overcoming the challenges of accessing and manipulating historical index data, we've also introduced a practical application of this data by reserachers: analyzing the historical sectoral distribution within an index.
- Register or Log in to applaud this article
- Let the author know how much this article helped you
Get In Touch
SOURCE CODE
Related Articles
Related APIs
Request Free Trial
Call your local sales team
Americas
All countries (toll free): +1 800 427 7570
Brazil: +55 11 47009629
Argentina: +54 11 53546700
Chile: +56 2 24838932
Mexico: +52 55 80005740
Colombia: +57 1 4419404
Europe, Middle East, Africa
Europe: +442045302020
Africa: +27 11 775 3188
Middle East & North Africa: 800035704182
Asia Pacific (Sub-Regional)
Australia & Pacific Islands: +612 8066 2494
China mainland: +86 10 6627 1095
Hong Kong & Macau: +852 3077 5499
India, Bangladesh, Nepal, Maldives & Sri Lanka:
+91 22 6180 7525
Indonesia: +622150960350
Japan: +813 6743 6515
Korea: +822 3478 4303
Malaysia & Brunei: +603 7 724 0502
New Zealand: +64 9913 6203
Philippines: 180 089 094 050 (Globe) or
180 014 410 639 (PLDT)
Singapore and all non-listed ASEAN Countries:
+65 6415 5484
Taiwan: +886 2 7734 4677
Thailand & Laos: +662 844 9576
