MLFLow is an open source MLOps tool that can be used to deliver enterprise level tracking and productionisation of AI systems. While MLFlow is fully compatible with deployments on the cloud we will be presenting a localhost flow. MLFlow consists of four main tools:
· MLFlow Tracking: An APi that allows us to visually track parameters and results of the pipeline. code versions, files, parameters, metrics, tags, and artifacts can be tracked through tracking URIs. Eligible URIs include local file paths, SQLAlchemy compatible databases, http servers and databricks workspaces. Access to these URIs is supported through Python, R, Java and REST APIs. This article is focusing on Python implementations.
· MLFlow Projects: This module is used to package ML code for distribution and sharing as well as for productionisation processes. Solutions can be packaged including dependencies, e.g. python environment, under an MLproject file that can then be used as a single entry point for the entire pipeline.
· MLFlow Models: The tool allows us to save a multitude of the most prominent ML models in many different formats. The MLformat model can then be used as a package to be deployed to all the popular inference platforms. At its simplest format, MLFlow will automatically deploy a REST endpoint for each MLmodel file to allow inference.
· MLFlow Registry: A model store managing the entire lifecycle of the ML pipeline.
These components can be either used on an isolated basis or as a framework able to productionise an end-to-end MLOps process.
Installing MLFlow
Installing MLFlow is as simple as executing a pip command like:
pip3 install mlflow
Equally convenient on Anaconda execute:
conda install -c conda-forge mlflow
Thereafter launching the MLFlow UI is as simple as executing the command mlflow ui in the command line. By default, the interface connects to port 5000, so starting a browser pointing at localhost:5000 will start the interface.
MLFlow tracking
All logging and tracking capabilities in MLFlow evolve around the concept of a run. Anything recorded during a run can be stored to several different URIs including:
· Local filesystem store
· Database management systems that are supported including mySQL MS SQL Server, sqlite and postgresql.
· A remote tracking server that is hosting an MLFLow tracking server
· A Databricks workspace
MLFlow provides tracking capabilities by utilizing two different components, the backend store and the artifacts store. The former is used to track parameters, metrics, tags, notes and metadata while the later is used to persist artifacts such as models and other in-memory objects.
Depending on the scenario MLFlow storage structures will differ and the appropriate infrastructure should be in place to facilitate the tracking components. Regardless of the choice of architecture data can be logged using either Python, R, Java or the available REST API.
For each run we can store the following information:
· Code version: The corresponding commit hash
· Starting and end time of the run
· Source: Main entry point for the run
· Parameters: Key-Value string pairs
· Metrics: Key-Value numeric pairs, MLFLow will also visualize these metrics
· Artifacts: Output files.
One of the very interesting functions of MLFLow tracking is automatic logging. A single call to mlflow.autolog() will enable auto-logging for any of the directly supported libraries including scikit-learn, Tensorflow and Keras, xgboostspark, pytorch and more.
Runs can be grouped under the concept of experiments that can be created either from the CLI or through Python. To setup an experiment group we need to define the system variable MLFLOW_EXPERIMENT. Alternatively we can use the python commands create_experiment() and get_experiment_id():
The experiment is stored in the backend store and all the runs will be associated with it; however, the experiment name cannot be used again before it gets deleted from the store. To delete an experiment from the store, use the command:
mlflow.delete(experiment_id)
To manually store logs or enhance the auto logging mlflow output during the experiment run, use the mlflow log_param(), log_metric(), set_tag() and log_artifact() commands within the context the run.
The logging results of the runs can be inspected through various processes the easiest one being running mlflow ui on top of the mlruns directory if you are using the file system as a file store. The MLFlow UI provides several features including experiment comparisons, searching and visualizing results as well as exporting results for further analysis.
Let’s use the excellent “Using Economic Indicators with Eikon Data API - A Machine Learning Example” as a testbed to enable MLFlow Tracking, use the auto-logging mechanisms for XGBoost and enhance them with our custom logging functionality. First, we need to import MLFlow:
import mlflow
Then we create a new experiment group we call XGBoost Experimentation and we make sure to check that it does not already exist in the local store (we will be using ./mlruns as our file store, but all the concepts remain the same regardless of the storage URI.
experiment_name = "XGBoost-mlflow"
experiment = mlflow.get_experiment_by_name(experiment_name)
if not experiment:
experiment_id = mlflow.create_experiment(experiment_name)
Enabling autologging for xgboost is as simple as adding the command at the start of our code, let’s also set the experiment to log under using the set_experiment() command:
mlflow.set_experiment(experiment_name=experiment_name)
mlflow.xgboost.autolog()
Once the code runs, we can start the MLFLow UI. A new entry is now available in the UI and under the newly created experiment group we can find the most recent run.
If we click on the entry, we can navigate ourselves to all the data that the MLFlow auto-logging mechanism has stored in our file system.
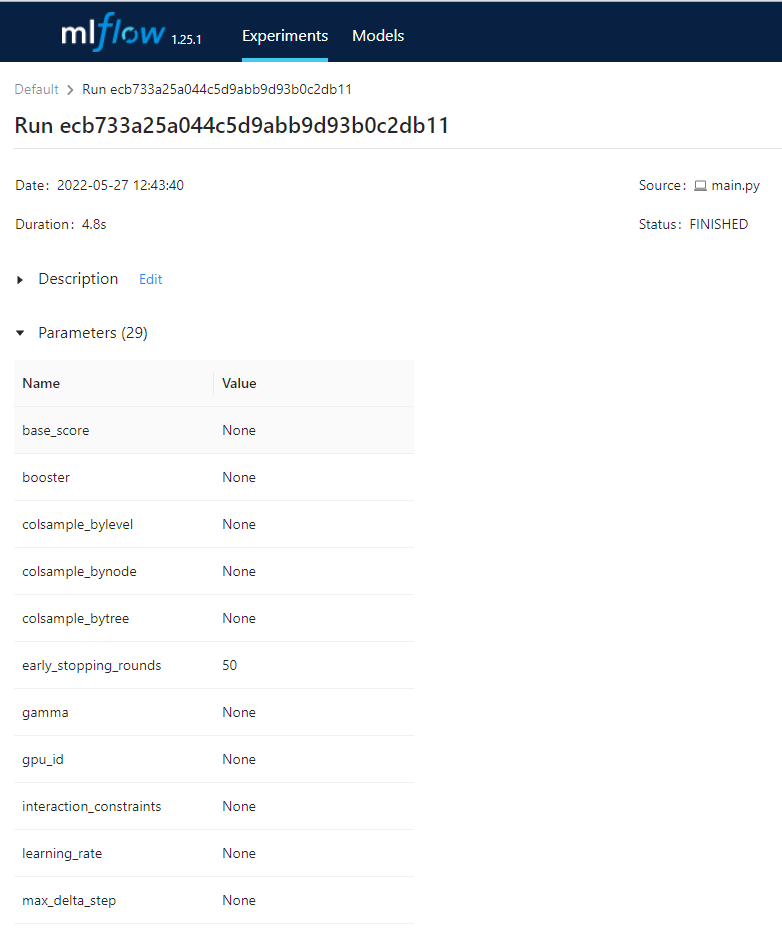
In the parameters tab, we can see that MLFLow stores all possible 29 parameters that can be used to instantiate an XGBoost model:
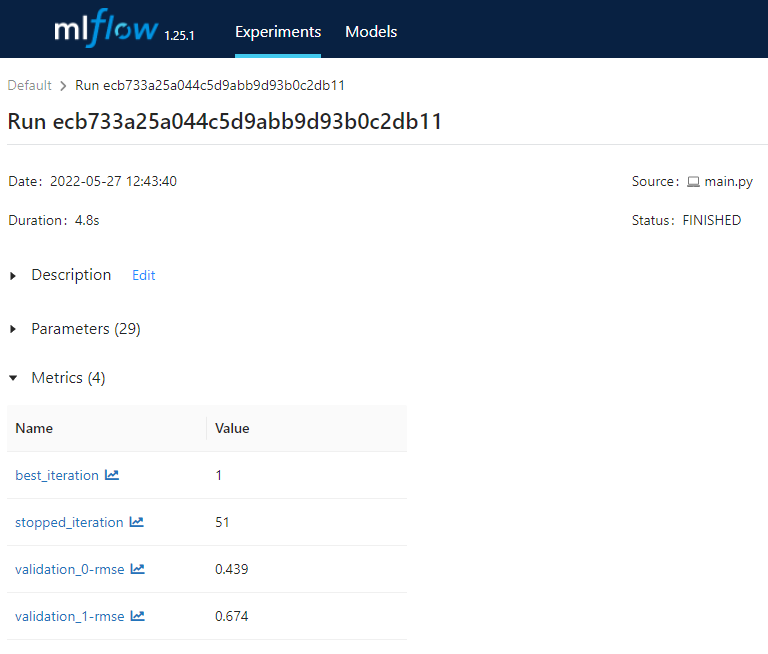
In the metrics tab we an find all statistical metrics that describe the behaviour and performance of the model such as best_iteration, stopped_iteration, validation_rmse:
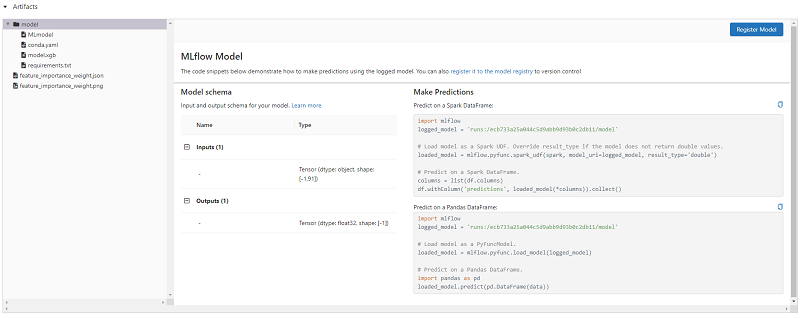
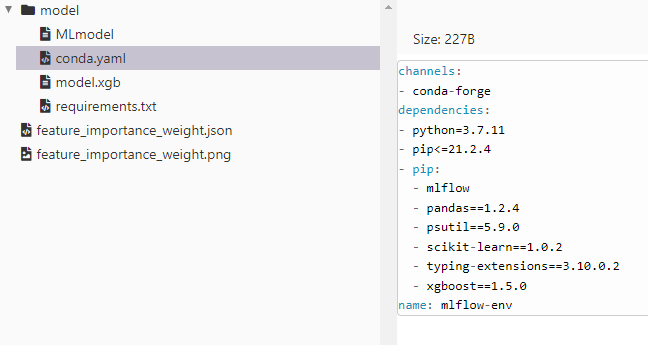
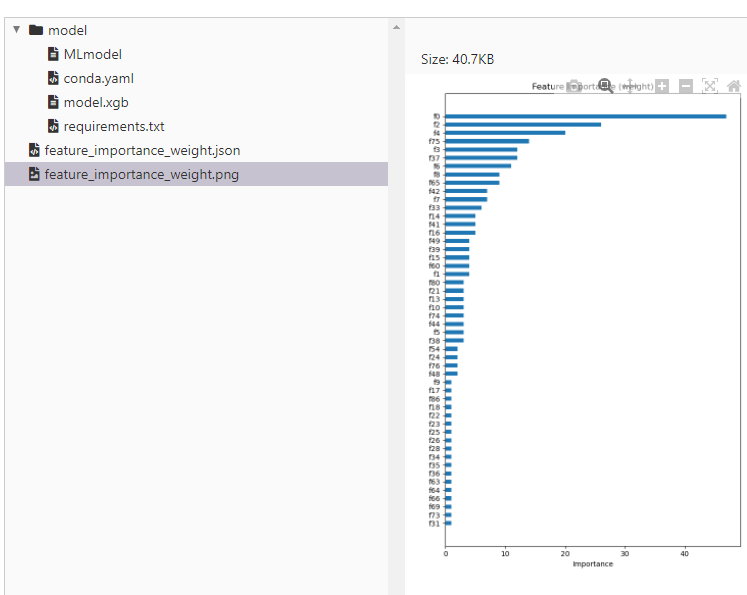
Another interesting tab is the artifacts tab. In that, amongst any artifacts we requested to be saved through the parameters of the auto-logging function, we can find, the actual ML model that has been saved, a yaml file describing the environment as well feature importance weights as calculated by the script both in json format as well as the actual png output produced. Furthermore, MLFlow provides us with sample code to write to use the saved models for predictions both within Spark as well as in a localised desktop environment. The following two images present the environment dependencies as can be seen through the interface as well feature importance analysis results:
Serving the tracked MLFLow models
MLFlow saves the tracked model in a format that is ready to be served in a productionised environment. All we need to do is use the mlflow models serve command from the command prompt and the specific run_id under which we can find the model we would like to be served.
mlflow models serve -m runs:/ecb733a25a044c5d9abb9d93b0c2db11/model --port 1245
Using this command MLFlow will try to replicate the entire anaconda environment needed by updating Anaconda if needed and downloading all dependencies. It will even go through the process of creating a new environment using the unique run-id from the tracked pipeline. We can see in the following snapshot that it will then serve the model on the port specified.
Once the model server is online simply using the curl command, we can query the model for predictions:
curl -d ‘{‘columns’: [‘’], ‘data’: []} -H ‘Content-Type: application/json; format=pandas-split’ -X POST localhost:1245/invocations
Conclusions
In this Blueprint we discuss MLFlow, an open source MLOps tool that can be used to deliver enterprise level AI systems. We present the basic functionality and demonstrate how easy it is to start using MLFlow to track MLOps results during experiments. MLFlow auto-loging is available for a multitude of models and the level of granularity concerning the output that is been saved can be determined through the numerous parameters available within the function call. After we examined the MLFlow tracing output we also used the saved model structures to quickly start a server that will deploy the models for predictions.


