Authors:

In this article, we will investigate Public Companies' Climate targets and whether they are on track to meet them. The data needed for such an investigation is not onboarded on LSEG's Data Platform yet; but, thankfully, it is on LSEG's Sustainable Finance Investing (SFI) Snowflake.
LSEG collects data from a range of sources; for climate data, we rely on our analysts to retrieve the information directly from companies’ disclosures. The most exciting data onboarded has, recently, related to ESG and Climate topics. From popular demand, we distribute Sustainable Finance and Investing (SFI) data via the Datawarehouse known as Snowflake. SFI Snowflake can be accessed via Snowflake's online platform or simply using Python via Snowflake's API wrapper named Snowpark. Datasets available include ESG, Climate, EU Taxonomy and Green Revenues data. Snowflake's API is a REST API, just like LSEG's Data Platform; similarly, Snowflake created a module to wrap their API into the Python (as well as Scala and Java) module snowpark (in their Python library snowflake), just as we wrapped LSEG's Data Platform REST API into LSEG's Data Library for Python.
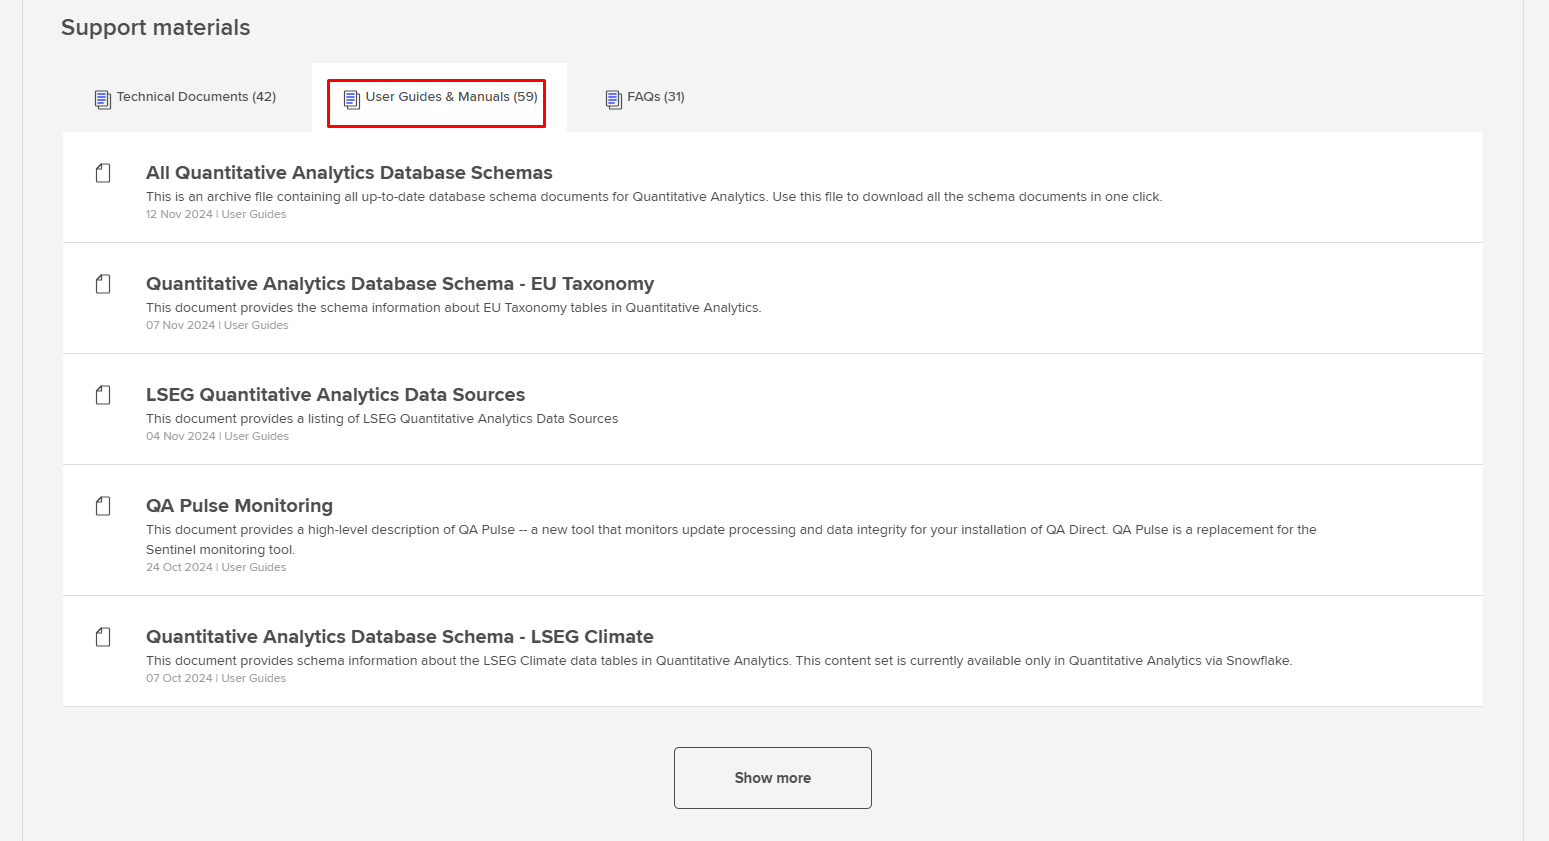
For more information on the data available on LSEG's SFI Snowflake, please look into myaccount.lseg.com/en/product/quantitative-analytics. Here you will find all the related documentation necessary to understand the data-model we are leveraging. Please be aware that SFI is a set of data the SFI datasets are surfaced via the QA Quantitative Analytics (QA) product; LSEG collates several sets of data in tables in QA; some are packaged commercially-speaking under the name of 'Datastream', others under the name 'Worldscope', among these many packages, we are only interested in 'SFI' which is easy to access using Snowflake. When logging into myaccount.lseg.com/en/product/quantitative-analytics, you can access PDF documentation files:
Personally, I'm a fan of accessing such information programmatically. In this article, I'll take you through how one can do just that.
Beginner's steps: SFI Snowflake using Snowpark to collect ESG data
We first need to import the snowflake-snowpark-python library. This library allows us to connect to Snowflake's services without having to deal with things like authentication tokens ourselves:
## pip install snowflake-snowpark-python
## pip install "snowflake-connector-python[pandas]"
from snowflake import snowpark
import pandas as pd
import os # This is a native library that will allow us to collect authentication details from the machine where we're running our code.
import plotly.graph_objects as go # `plotly` and its modules are useful for us to plot graphs
import numpy as np # `numpy` in this case will be useful for us to plot graphs
In the cell below, we create the global variable g_db_session in which we will insert our authentication details. This will enable us to invoke it like an object that we can use to access SFI data. To "insert our authentication details", we will create the get_session function:
# Global variable
g_db_session = None
def get_session(user, password):
global g_db_session
# Establish a connection and assign it to the global session variable
connection_parameters = {
"account": "rddpreprod1.east-us-2.azure",
"user": user,
"password": password,
"warehouse": "SFI_READER_S_WH",
"database": "SHAREDB_SFI_MVP",
"role": "SNO_SNOREFDBD_SFI_READER_ROLE",
"schema": "DBO",
"authenticator": "externalbrowser"
}
g_db_session = snowpark.Session.builder.configs(connection_parameters).create()
Let's pick an Organisation's Permanent IDentifier (OrgPermID) at random for now:
OrgPermID = "4295875633"
Note that we do not want to show our passwords, or enter it anywhere viewable to anyone reading our code. Therefore, instead of entering our password in a string, we'll create a session in the global g_db_session object that opens a browser window where you can enter your credentials and log into Snowflake using your password:
get_session("john.doe@domain.com", os.getenv('SSO_PASSWD'))
Now we can send out SQL query:
# Retrieve the data from Snowflake
query_esg = f"""
SELECT S.FY, S.SCORECALCDT, S.SCORE, I.TITLE
FROM ESG2SCORES S
JOIN ESG2ITEM I ON S.ITEM = I.ITEM
WHERE S.ORGPERMID = {OrgPermID} and I.ITEM IN (2,4,5,6,7,8,9,10,11,12,13,14,15,16,65)
"""
# Execute the query and get the DataFrame
df_esg = g_db_session.sql(query_esg).toPandas()
display(df_esg)
| FY | SCORECALCDT | SCORE | TITLE | |
| 0 | 2008 | 12:43.4 | 0.950658 | Workforce Score |
| 1 | 2008 | 12:43.4 | 0.900794 | Emissions Score |
| ... | ... | ... | ... | ... |
| 306 | 2017 | 10:38.0 | 0.898148 | CSR Strategy Score |
| 307 | 2017 | 10:38.0 | 0.422414 | Shareholders Score |
| 308 rows × 4 columns |
# Pivot the DataFrame to get the desired format
pivot_df_esg = df_esg.pivot(index='FY', columns='TITLE', values='SCORE')
# Return most recent FY
pivot_df_esg = pivot_df_esg.iloc[[-1]].reset_index(drop=True)
pivot_df_esg.columns.name = None
display(pivot_df_esg)
| CSR Strategy Score | Community Score | ESG Combined Score | Emissions Score | Environment Pillar Score | Environmental Innovation Score | Governance Pillar Score | Human Rights Score | Management Score | Product Responsibility Score | Resource Use Score | Shareholders Score | Social Pillar Score | Workforce Score | |
| 0 | 0.95 | 0.968165 | 0.481272 | 0.806513 | 0.827386 | 0.761364 | 0.84 | 0.909524 | 0.956 | 0.787698 | 0.895062 | 0.38 | 0.925768 | 0.990637 |
Intermediary steps: SFI Snowflake using the browser to collect Company data
Above, we picked a random OrgPermID, but how can we find the company it relates to? As it turns out, the answer to this question using SFI and SQL code allows us to go quite far.
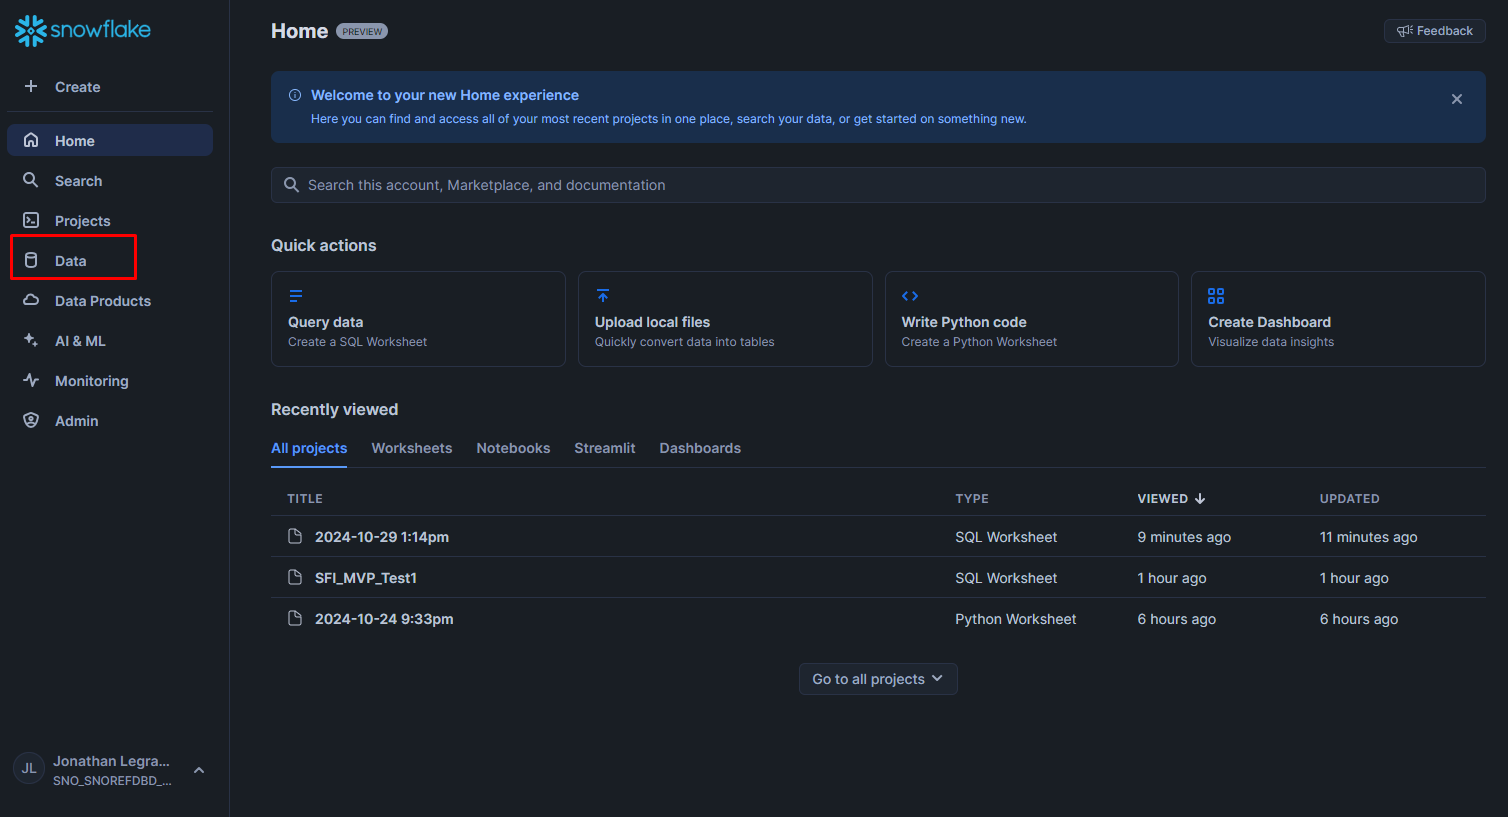
When you open your Snowflake homepage, you ought to be greeted with something looking like:
The main difference should be that you have no ongoing projects.
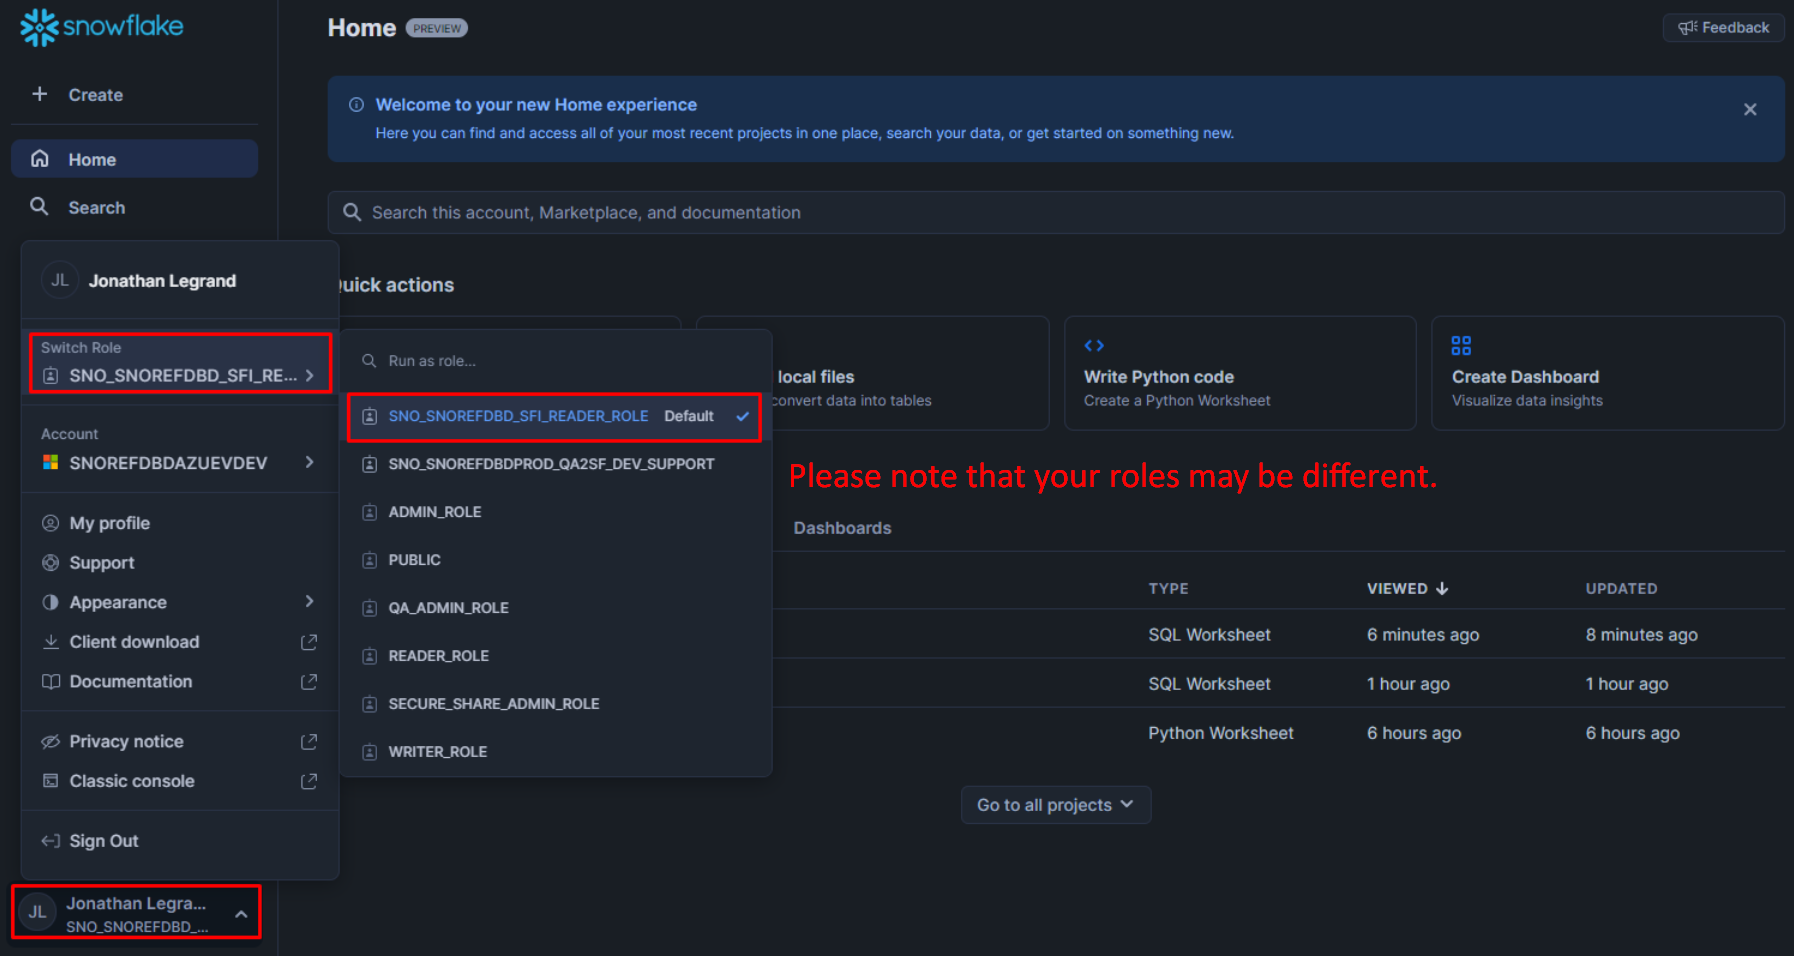
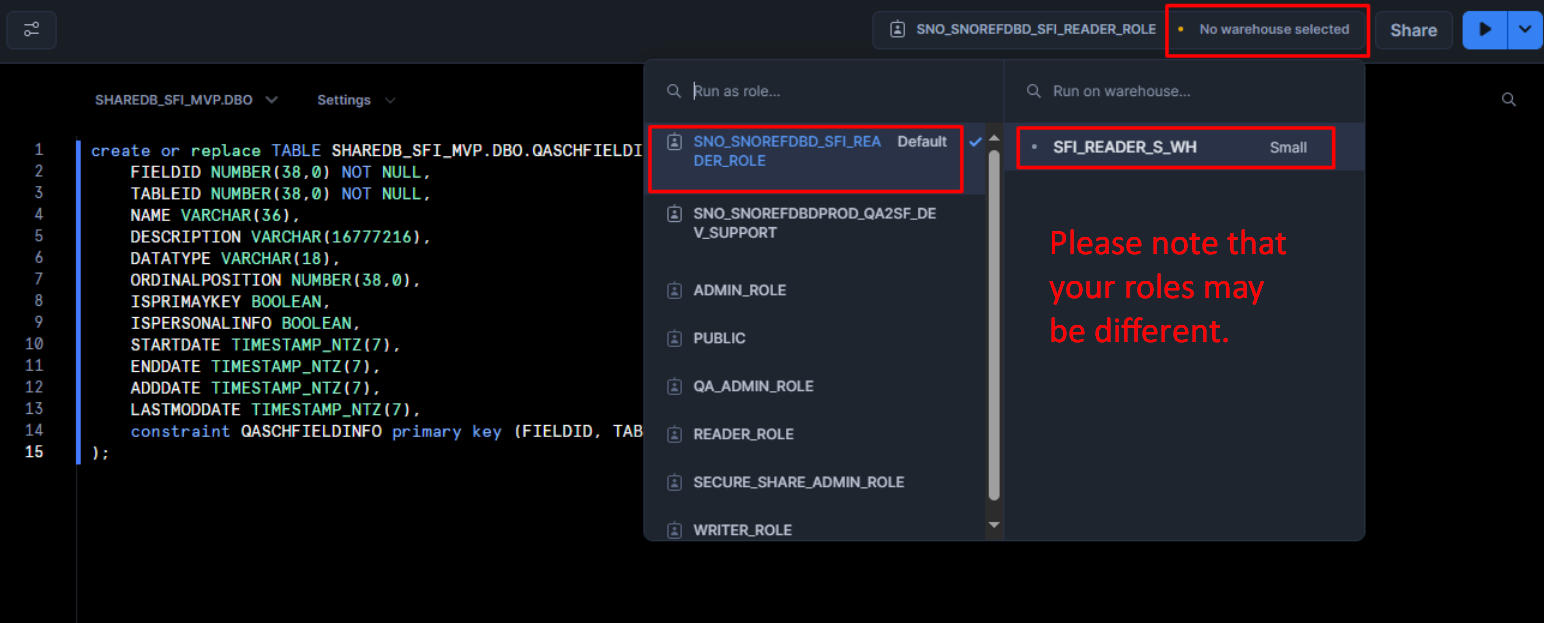
What we're trying to do here is to find the place where company information lies, then maybe we can find out which company has OrgID '4295875633'. To do this, let's first select our Role (for more info on Roles, please read Snowflake's documentaiton):
Now that we have selected our role, let's dig through the databases we have access to:
In this article, we focus on SFI databases available on Snowflake, specifically "SHAREDB_SFI_MVP" & "SFI_MASTER_MVP":
I would advise starting with the SHAREDB_SFI_MVP.DBO.QASchTableInfo table (i.e.: the SHAREDB_SFI_MVP parent database, the DBO child database, the QASchTableInfo table):
We can see what data lives in this table with the 'Open in Worksheet' option:
We, unfortunately have to pick our role again:
I would advise changing the code too, since we don't have permission to change any of the data in tables. I go for:
SELECT TOP 10 * FROM SHAREDB_SFI_MVP.DBO.QASCHFIELDINFO
Snowflake Python Worksheets
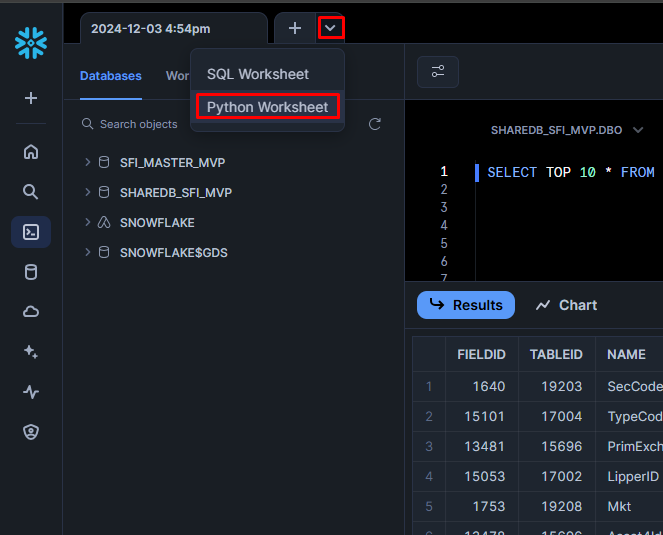
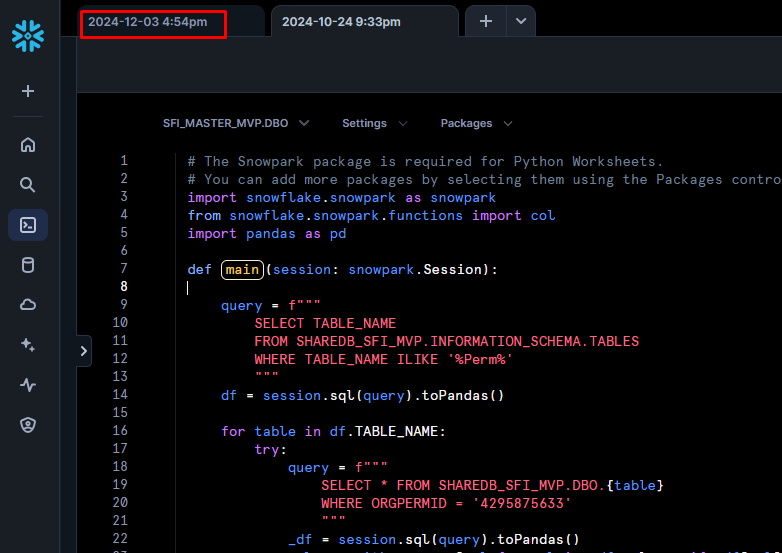
Let's see what company is linked with this OrgPermID '4295875633'. To do so, we'll need to venture in the world of Python and Snowflake Worksheets. Open a new Python Worksheet:
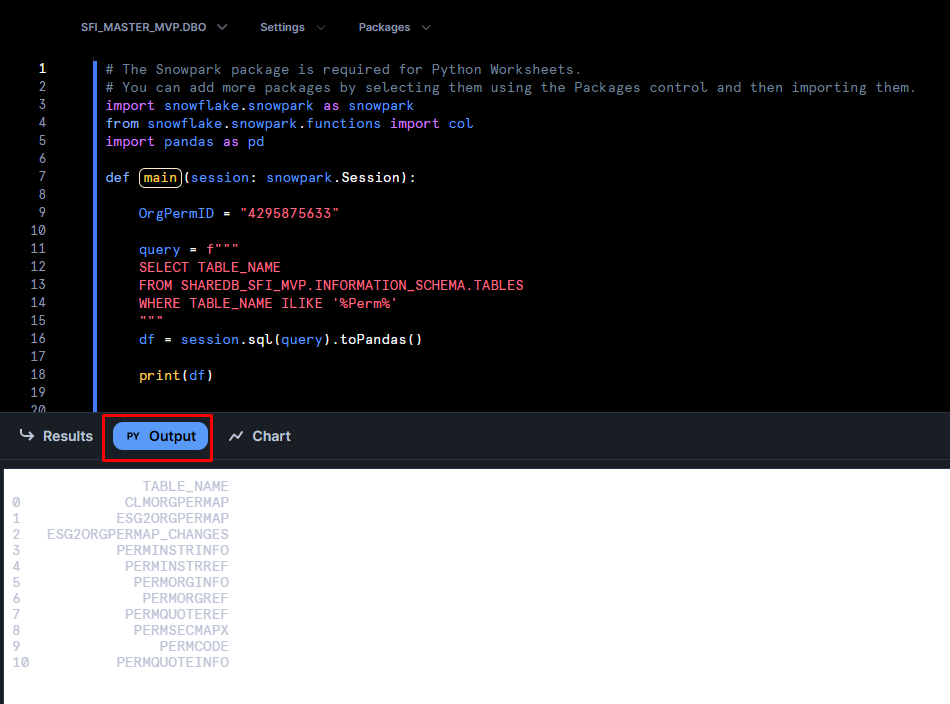
Let's run the code we had above, but in Snowflake's Worksheets:
# The Snowpark package is required for Python Worksheets.
# You can add more packages by selecting them using the Packages control and then importing them.
import snowflake.snowpark as snowpark
from snowflake.snowpark.functions import col
import pandas as pd
def main(session: snowpark.Session):
OrgPermID = "4295875633"
query = f"""
SELECT TABLE_NAME
FROM SHAREDB_SFI_MVP.INFORMATION_SCHEMA.TABLES
WHERE TABLE_NAME ILIKE '%Perm%'
"""
df = session.sql(query).toPandas()
print(df)
- In line 9, OrgPermID = "4295875633" precises the company for which we were doing our search.
- Line 11 through to 15 was our SQL query which we will send to Snowflake to run as if we were simply in a SQL Worksheet as before. This code selects the name of all the tables that can be found in the SHAREDB_SFI_MVP database.
- Line 16's session.sql(query).toPandas() uses the session created in lines 1 to 8 to send the query and transforms it into a pandas dataframe. Pandas dataframes are easy to manipulate in Python, although you can choose other types from which to work. We output this dataframe in the object df.
- In line 18, we simply print this dataframe so we can see it in the Output window below the code window in Snowflake's browser window.
You may wonder "why did we create python code simply just to send SQL code to Snowflake, when we could do this directly in Snowflake SQL Worksheets?". Great question; the reason is that we can't use loops in SQL Worksheets! Whereas in Python Worksheets, now we can use the table names to search for the ORGPERMID '4295875633' by using the below in the main function:
query = f"""
SELECT TABLE_NAME
FROM SHAREDB_SFI_MVP.INFORMATION_SCHEMA.TABLES
WHERE TABLE_NAME ILIKE '%Perm%'
"""
df = session.sql(query).toPandas()
for table in df.TABLE_NAME:
try:
query = f"""
SELECT * FROM SHAREDB_SFI_MVP.DBO.{table}
WHERE ORGPERMID = '4295875633'
"""
_df = session.sql(query).toPandas()
if len(_df) > 0:
print("\n")
print(f"{table}")
print(_df.T)
except:
print("\n")
print(f"{table} didn't have a 'ORGPERMID' column")
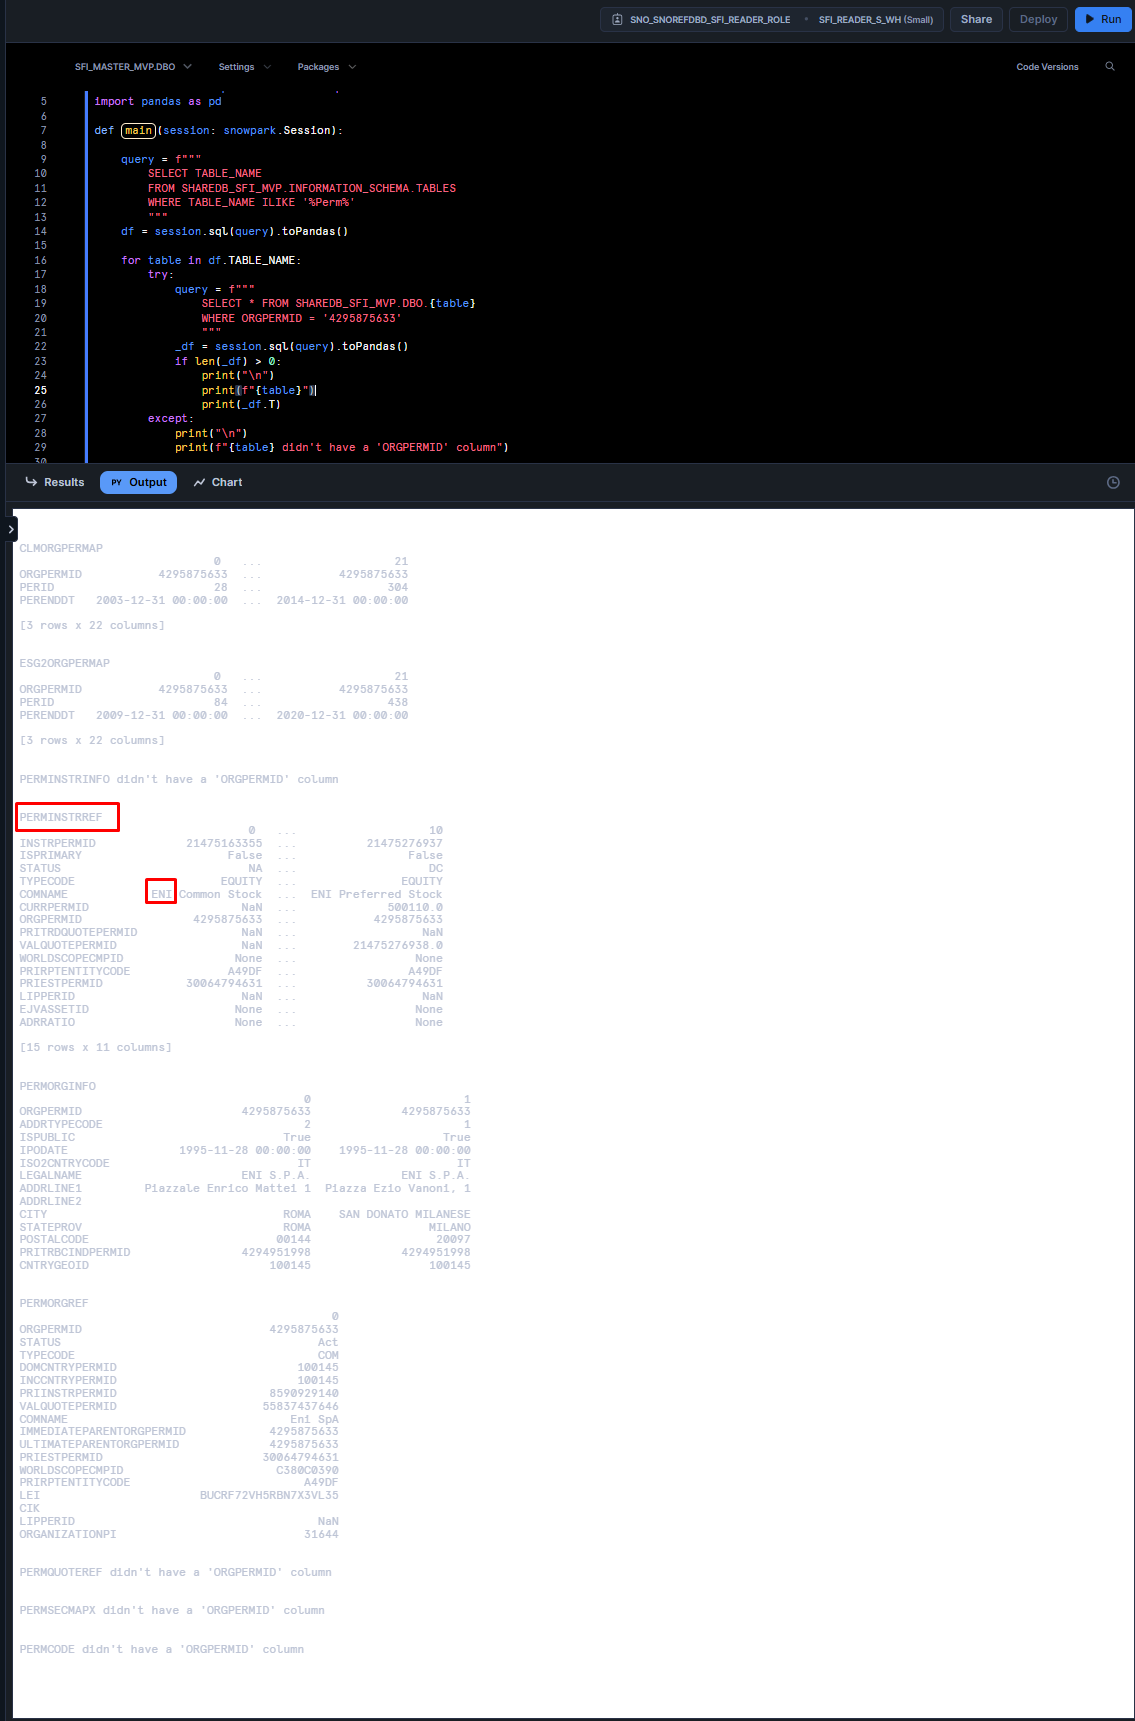
- In line 9 to 13, we create our SQL query, embedding our OrgPermID "4295875633", selecting the table names that were outputted before, all to have this list of tables in the dataframe df on line 14.
- In line 16, we start a loop for each table in our df and, from line 18 to 22, create & run queries to collect data from these tables.
- Note that, in line 17, we start a try loop. This is due to the fact that some tables will not have an ORGPERMID column, and the code will fail. In line with this, we create an except statement from line 27 to 29.
- Finally, from line 23 to 36, we make sure that if we receive data from our SQL query, we display this data with print statements.
We can now see from the PERMINSTRREF table that the company probably is "ENI" (as highlighted in red boxes in the image above); but let's check. With this code below, I only output the table and columns names for which "ENI" is found, fully or partially:
query = f"""
SELECT TABLE_NAME
FROM SHAREDB_SFI_MVP.INFORMATION_SCHEMA.TABLES
WHERE TABLE_NAME ILIKE '%Perm%'
"""
df = session.sql(query).toPandas()
for table in df.TABLE_NAME:
try:
query = f"""
SELECT * FROM SHAREDB_SFI_MVP.DBO.{table}
WHERE ORGPERMID = '4295875633'
"""
_df = session.sql(query).toPandas()
columns_with_name = [col for col in _df.columns if _df[col].astype(str).str.contains('ENI', case=False, na=False).any()]
if len(_df) > 0 and len(columns_with_name) > 0:
print("\n")
print(f"Table {table}'s columns where 'ENI' appears:", columns_with_name)
except:
print("\n")
print(f"{table} didn't have a 'ORGPERMID' column")
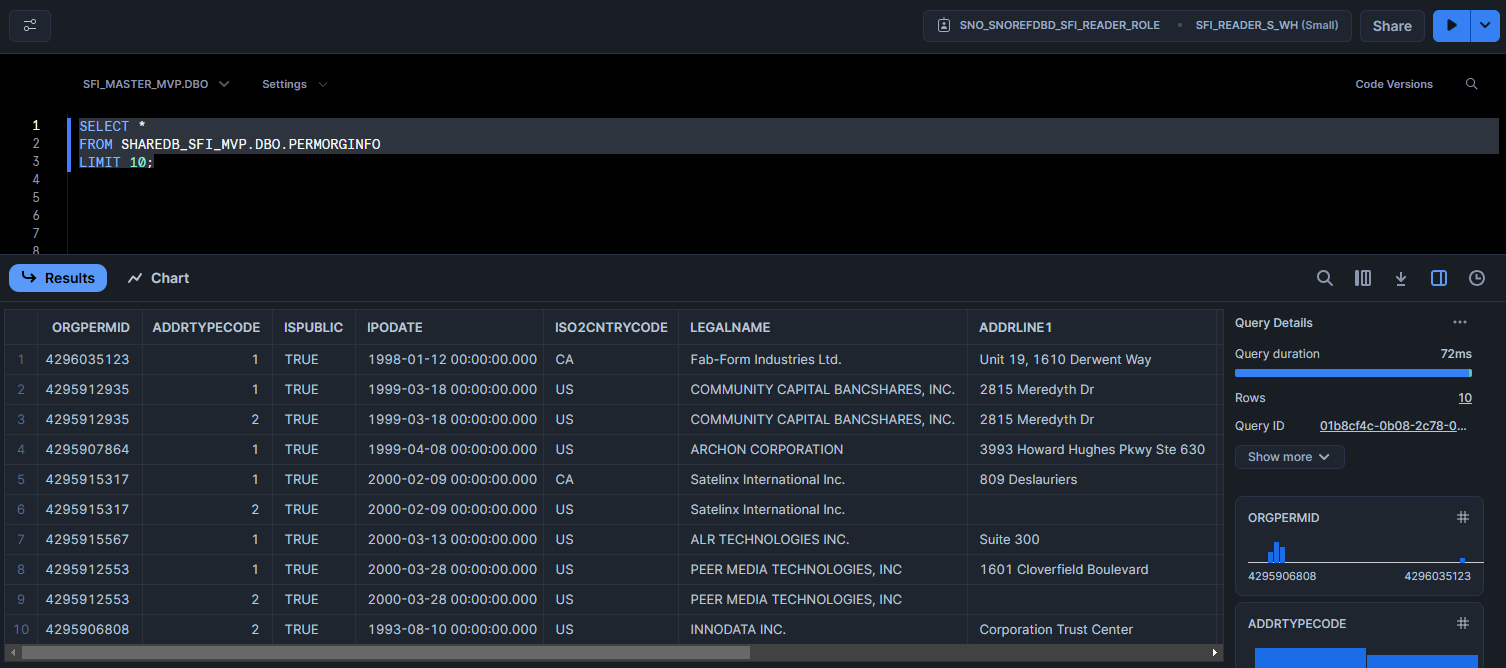
I like the sound of LEGALNAME; let's look into it. First let's return to our SQL worksheet:
and let's use
SELECT *
FROM SHAREDB_SFI_MVP.DBO.PERMORGINFO
LIMIT 10;
LEGALNAME is indeed quite a lot better; we were right to check all the table and columns names for which "ENI" is found, fully or partially, since it looks like we should focus on table SHAREDB_SFI_MVP.DBO.PERMORGINFO.
While we looked for this OrgId, you saw that data is split in between all the different databases. Looking for the correct database is a little difficult, but once you get a handle of the Python Worksheets, it's easier.
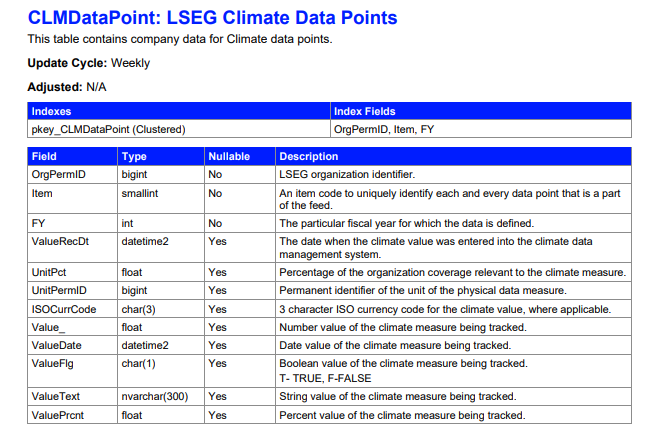
Now, going forward, we are looking for climate data. For this article, I was after Climate data, specifically Green House Gasses Emissions; which is often abbreviated to GHG (i.e.: GHGEmission). Looking into the myaccount.lseg.com/en/product/quantitative-analytics files related to Climate Data, I found promising information about the SFI_MASTER_MVP.DBO.CLMDataPoint database:
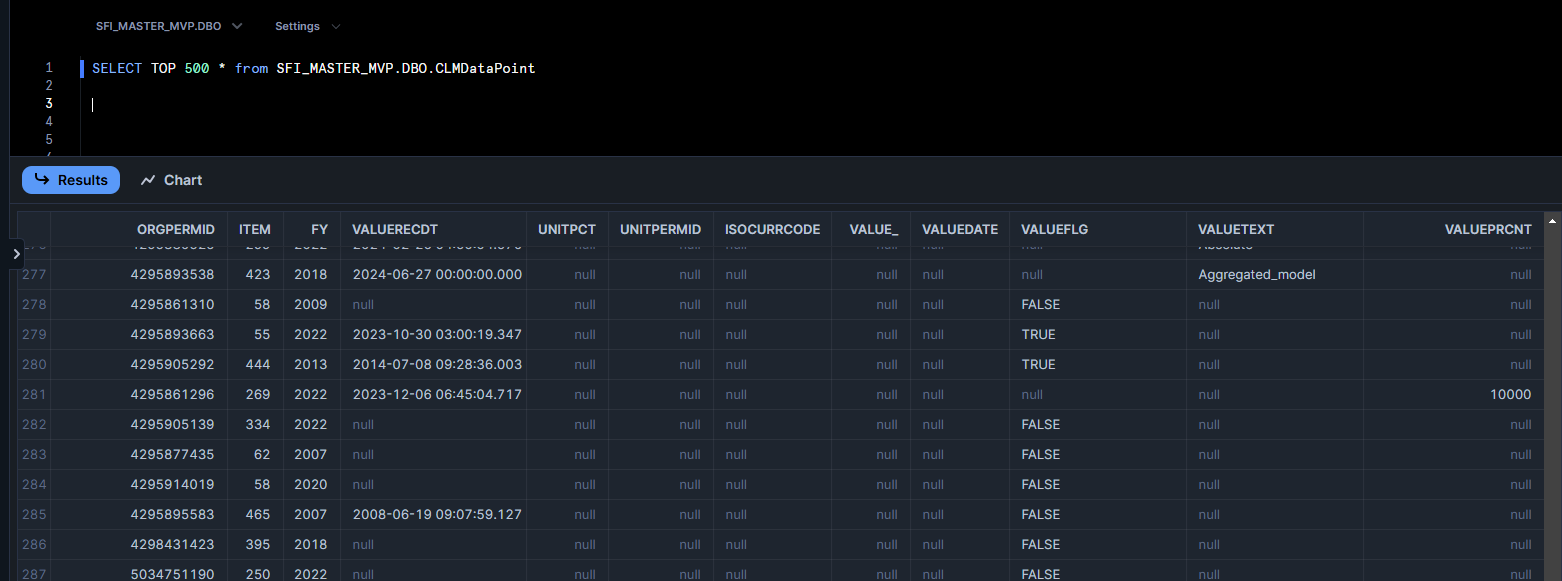
Let's look into SFI_MASTER_MVP.DBO.CLMDataPoint
Here's ORGPERMID again, let's use this. If you look through the documentation as we did to find SFI_MASTER_MVP.DBO.CLMDataPoint, you'll see that there is a table called SFI_MASTER_MVP.DBO.CLMITEM with item names in full; there I found 'ShortTermSet1GHGEmissionPercentageReductionTargeted', which was a good candidate for being the item I'm interested in. We can pick the data in our CLMDataPoint that only relate to this item:
SELECT *
FROM SFI_MASTER_MVP.DBO.CLMDataPoint
WHERE ORGPERMID = 4295875633
AND ITEM IN (
SELECT ITEM
FROM SFI_MASTER_MVP.DBO.CLMITEM
WHERE FEEDFIELDNAME = 'ShortTermSet1GHGEmissionPercentageReductionTargeted'
);
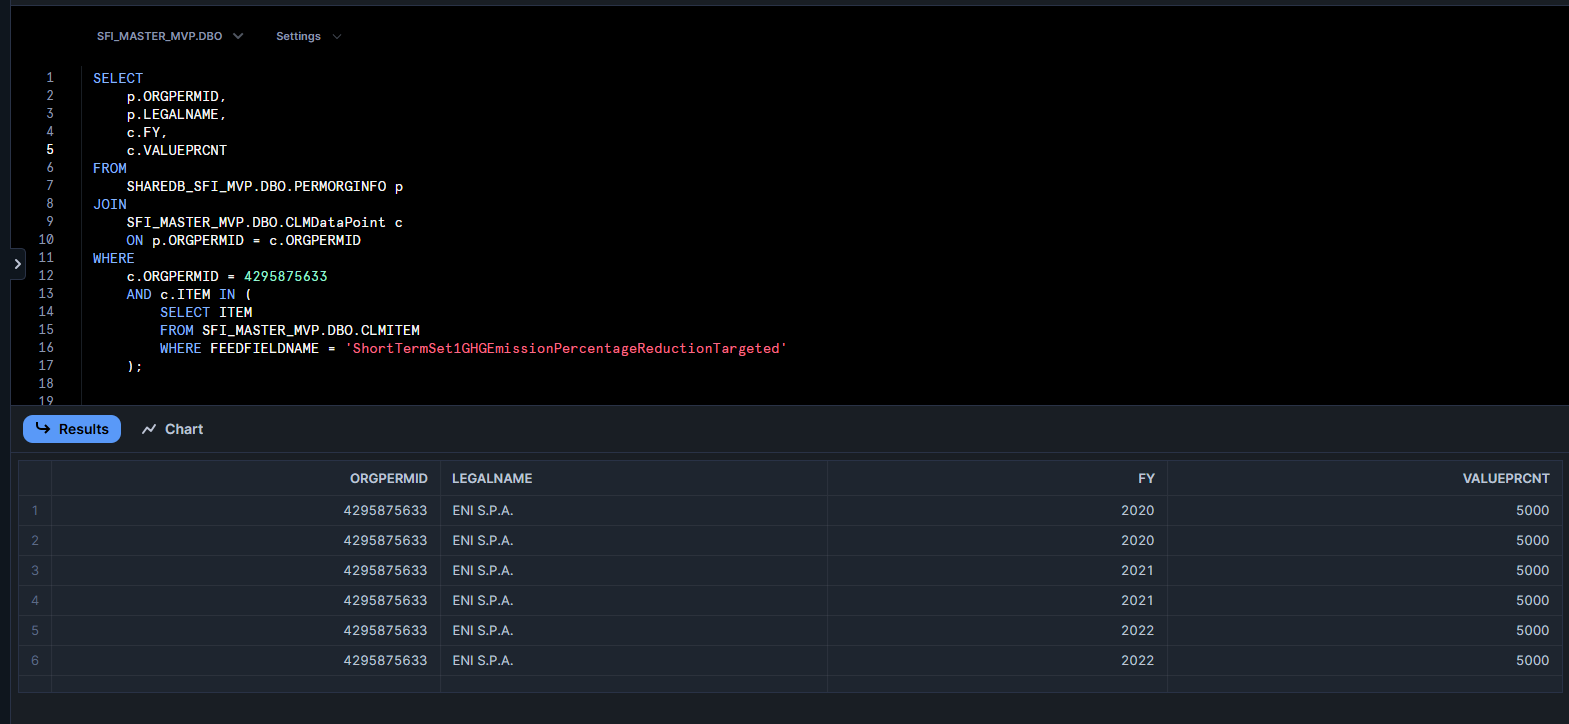
Let's join our tables to return only the data we're after:
SELECT
p.ORGPERMID,
p.LEGALNAME,
c.FY,
c.VALUEPRCNT
FROM
SHAREDB_SFI_MVP.DBO.PERMORGINFO p
JOIN
SFI_MASTER_MVP.DBO.CLMDataPoint c
ON p.ORGPERMID = c.ORGPERMID
WHERE
c.ORGPERMID = 4295875633
AND c.ITEM IN (
SELECT ITEM
FROM SFI_MASTER_MVP.DBO.CLMITEM
WHERE FEEDFIELDNAME = 'ShortTermSet1GHGEmissionPercentageReductionTargeted'
);
Advanced steps: SFI Snowflake using Python and Snowpark
We can get inthe meat of the subject now, and use Python to fetch the data we're after in SFI Snowflake to then create the output we're after: investigate Public Companies' Climate targets and whether they are on track to meet them. To do this, we'll try and create a graph exemplifying our investigation results.
We can do everything we did above, but using Python, e.g.: get the tables of SHAREDB_SFI_MVP:
query = f"""
SELECT TABLE_NAME
FROM SHAREDB_SFI_MVP.INFORMATION_SCHEMA.TABLES
WHERE TABLE_NAME ILIKE '%Perm%'
"""
df = g_db_session.sql(query).toPandas()
display(df)
| TABLE_NAME | |
| 0 | CLMORGPERMAP |
| 1 | ESG2ORGPERMAP |
| 2 | ESG2ORGPERMAP_CHANGES |
| 3 | PERMINSTRINFO |
| 4 | PERMINSTRREF |
| 5 | PERMORGINFO |
| 6 | PERMORGREF |
| 7 | PERMQUOTEREF |
| 8 | PERMSECMAPX |
| 9 | PERMCODE |
| 10 | PERMQUOTEINFO |
Look through these tables to find the table we're after:
dfs = {}
for table in df.TABLE_NAME:
try:
query = f"""
SELECT * FROM SHAREDB_SFI_MVP.DBO.{table}
WHERE ORGPERMID = '4295875633'
"""
_df = g_db_session.sql(query).toPandas()
dfs[f"{table}"] = _df
if len(_df) > 0:
print(f"{table}")
display(_df)
except:
print(f"{table} didn't have a 'ORGPERMID' column")
| CLMORGPERMAP | |||||||||||||||||
| ORGPERMID | PERID | PERENDDT | |||||||||||||||
| 0 | 4295875633 | 94 | 31-12-11 | ||||||||||||||
| 1 | 4295875633 | 438 | 31-12-20 | ||||||||||||||
| … | … | … | … | ||||||||||||||
| 20 | 4295875633 | 456 | 31-12-21 | ||||||||||||||
| 21 | 4295875633 | 123 | 31-12-12 | ||||||||||||||
| ESG2ORGPERMAP | |||||||||||||||||
| ORGPERMID | PERID | PERENDDT | |||||||||||||||
| 0 | 4295875633 | 84 | 31-12-09 | ||||||||||||||
| 1 | 4295875633 | 36 | 31-12-04 | ||||||||||||||
| … | … | … | … | ||||||||||||||
| 20 | 4295875633 | 382 | 31-12-17 | ||||||||||||||
| 21 | 4295875633 | 438 | 31-12-20 | ||||||||||||||
| PERMINSTRINFO didn't have a 'ORGPERMID' column | |||||||||||||||||
| PERMINSTRREF | |||||||||||||||||
| INSTRPERMID | ISPRIMARY | STATUS | TYPECODE | COMNAME | CURRPERMID | ORGPERMID | PRITRDQUOTEPERMID | VALQUOTEPERMID | WORLDSCOPECMPID | PRIRPTENTITYCODE | PRIESTPERMID | LIPPERID | EJVASSETID | ADRRATIO | |||
| 0 | 21475235587 | FALSE | DC | EQUITY | ENI Spa Common Stock | 500110 | 4295875633 | NaN | 2.15E+10 | None | A49DF | 30064794631 | NaN | None | None | ||
| 1 | 8590925021 | FALSE | AC | EQUITY | ENI ADR | 500110 | 4295875633 | 5.58E+10 | 5.58E+10 | 26874R108 | A12C4 | 30064836885 | NaN | 2 | |||
| … | … | … | … | … | … | … | … | … | … | … | … | … | … | … | … | ||
| 9 | 21475351836 | FALSE | DC | EQUITY | ENI Preferred Stock | 500110 | 4295875633 | NaN | 2.15E+10 | None | A49DF | 30064794631 | NaN | None | None | ||
| 10 | 8590568485 | FALSE | AC | EQUITY | ENI CEDEAR | 500114 | 4295875633 | NaN | 5.58E+10 | A49DF | 30064794631 | NaN | 0.25 | ||||
| PERMORGINFO | |||||||||||||||||
| ORGPERMID | ADDRTYPECODE | ISPUBLIC | IPODATE | ISO2CNTRYCODE | LEGALNAME | ADDRLINE1 | ADDRLINE2 | CITY | STATEPROV | POSTALCODE | PRITRBCINDPERMID | CNTRYGEOID | |||||
| 0 | 4295875633 | 2 | TRUE | 28-11-95 | IT | ENI S.P.A. | Piazzale Enrico Mattei 1 | ROMA | ROMA | 144 | 4294951998 | 100145 | |||||
| 1 | 4295875633 | 1 | TRUE | 28-11-95 | IT | ENI S.P.A. | Piazza Ezio Vanoni, 1 | SAN DONATO MILANESE | MILANO | 20097 | 4294951998 | 100145 | |||||
| PERMORGREF | |||||||||||||||||
| ORGPERMID | STATUS | TYPECODE | DOMCNTRYPERMID | INCCNTRYPERMID | PRIINSTRPERMID | VALQUOTEPERMID | COMNAME | IMMEDIATEPARENTORGPERMID | ULTIMATEPARENTORGPERMID | PRIESTPERMID | WORLDSCOPECMPID | PRIRPTENTITYCODE | LEI | CIK | LIPPERID | ORGANIZATIONPI | |
| 0 | 4295875633 | Act | COM | 100145 | 100145 | 8590929140 | 55837437646 | Eni SpA | 4295875633 | 4295875633 | 30064794631 | C380C0390 | A49DF | BUCRF72VH5RBN7X3VL35 | NaN | 31644 | |
| PERMQUOTEREF didn't have a 'ORGPERMID' column | |||||||||||||||||
| PERMSECMAPX didn't have a 'ORGPERMID' column | |||||||||||||||||
| PERMCODE didn't have a 'ORGPERMID' column | |||||||||||||||||
| PERMQUOTEINFO didn't have a 'ORGPERMID' column |
dfs = {}
for table in df.TABLE_NAME:
try:
query = f"""
SELECT * FROM SHAREDB_SFI_MVP.DBO.{table}
WHERE ORGPERMID = '4295875633'
"""
_df = g_db_session.sql(query).toPandas()
dfs[f"{table}"] = _df
columns_with_name = [col for col in _df.columns if _df[col].astype(str).str.contains('ENI', case=False, na=False).any()]
if len(_df) > 0 and len(columns_with_name) > 0:
print(f"Table {table}'s columns where 'ENI' appears:", columns_with_name)
except:
print(f"{table} didn't have a 'ORGPERMID' column")
PERMINSTRINFO didn't have a 'ORGPERMID' column
Table PERMINSTRREF's columns where 'ENI' appears: ['COMNAME']
Table PERMORGINFO's columns where 'ENI' appears: ['LEGALNAME']
Table PERMORGREF's columns where 'ENI' appears: ['COMNAME']
PERMQUOTEREF didn't have a 'ORGPERMID' column
PERMSECMAPX didn't have a 'ORGPERMID' column
PERMCODE didn't have a 'ORGPERMID' column
PERMQUOTEINFO didn't have a 'ORGPERMID' column
We can look for Climate data as we did before too:
query_climate = f"""
SELECT *
FROM SFI_MASTER_MVP.DBO.CLMDataPoint
WHERE ORGPERMID = {OrgPermID}
AND ITEM IN (
SELECT ITEM
FROM SFI_MASTER_MVP.DBO.CLMITEM
WHERE FEEDFIELDNAME = 'ShortTermSet1GHGEmissionPercentageReductionTargeted'
);
"""
# Execute the query and get the DataFrame
df_climate1 = g_db_session.sql(query_climate).toPandas()
display(df_climate1)
ORGPERMID |
ITEM | FY | VALUERECDT | UNITPCT | UNITPERMID | ISOCURRCODE | VALUE_ | VALUEDATE | VALUEFLG | VALUETEXT | VALUEPRCNT | |
| 0 | 4.3E+09 | 212 | 2022 | 28:33.6 | NaN | NaN | None | NaN | NaT | None | None | 5000 |
| 1 | 4.3E+09 | 212 | 2021 | 11:48.1 | NaN | NaN | None | NaN | NaT | None | None | 5000 |
| 2 | 4.3E+09 | 212 | 2020 | 42:59.0 | NaN | NaN | None | NaN | NaT | None | None | 5000 |
Let's collect only the data we're after:
df_climate2 = df_climate1[['ORGPERMID', 'FY', 'VALUERECDT', 'VALUEPRCNT']]
df_climate2
| ORGPERMID | FY | VALUERECDT | VALUEPRCNT | |
| 0 | 4.3E+09 | 2022 | 28:33.6 | 5000 |
| 1 | 4.3E+09 | 2021 | 11:48.1 | 5000 |
| 2 | 4.3E+09 | 2020 | 42:59.0 | 5000 |
Now let's collect company info too, as we did above, in Snowflake's SQL Worksheets:
query_climate = f"""
SELECT
c.FY,
p.ORGPERMID,
p.LEGALNAME,
c.VALUEPRCNT
FROM
SHAREDB_SFI_MVP.DBO.PERMORGINFO p
JOIN
SFI_MASTER_MVP.DBO.CLMDataPoint c
ON p.ORGPERMID = c.ORGPERMID
WHERE
c.ORGPERMID = 4295875633
AND c.ITEM IN (
SELECT ITEM
FROM SFI_MASTER_MVP.DBO.CLMITEM
WHERE FEEDFIELDNAME = 'ShortTermSet1GHGEmissionPercentageReductionTargeted'
);
"""
# Execute the query and get the DataFrame
df_climate1 = g_db_session.sql(query_climate).toPandas()
display(df_climate1)
| FY | ORGPERMID | LEGALNAME | VALUEPRCNT | |
| 0 | 2021 | 4.3E+09 | ENI S.P.A. | 5000 |
| 1 | 2021 | 4.3E+09 | ENI S.P.A. | 5000 |
| 2 | 2022 | 4.3E+09 | ENI S.P.A. | 5000 |
| 3 | 2022 | 4.3E+09 | ENI S.P.A. | 5000 |
| 4 | 2020 | 4.3E+09 | ENI S.P.A. | 5000 |
| 5 | 2020 | 4.3E+09 | ENI S.P.A. | 5000 |
Note now that we look for companies using their LEGALNAME with the below (note how, in line 13, we're looking for the name of a company, not the OrgId any more):
query_climate = f"""
SELECT
c.FY,
p.ORGPERMID,
p.LEGALNAME,
c.VALUEPRCNT
FROM
SHAREDB_SFI_MVP.DBO.PERMORGINFO p
JOIN
SFI_MASTER_MVP.DBO.CLMDataPoint c
ON p.ORGPERMID = c.ORGPERMID
WHERE
p.LEGALNAME ILIKE '%Total%'
AND c.ITEM IN (
SELECT ITEM
FROM SFI_MASTER_MVP.DBO.CLMITEM
WHERE FEEDFIELDNAME = 'ShortTermSet1GHGEmissionPercentageReductionTargeted'
);
"""
# Execute the query and get the DataFrame
df_climate1 = g_db_session.sql(query_climate).toPandas()
# df_climate1.drop_duplicates(subset=['FY']).sort_values(by=['FY'])
display(df_climate1)
| FY | ORGPERMID | LEGALNAME | VALUEPRCNT | |
| 0 | 2022 | 5E+09 | TotalEnergies SE | 1500 |
| 1 | 2022 | 5E+09 | TotalEnergies SE | 1500 |
Now I'm after another field of interest that I think ought to be in the same table, let's JOIN with SFI_MASTER_MVP.DBO.CLMITEM for all relevent FEEDFIELDNAMEs:
query_climate = f"""
SELECT *
FROM
SHAREDB_SFI_MVP.DBO.PERMORGINFO p
JOIN
SFI_MASTER_MVP.DBO.CLMDataPoint c
ON p.ORGPERMID = c.ORGPERMID
JOIN
SFI_MASTER_MVP.DBO.CLMITEM k
ON c.ITEM = k.ITEM
WHERE
p.LEGALNAME ILIKE '%TotalEnergies%'
AND c.ITEM IN (
SELECT ITEM
FROM SFI_MASTER_MVP.DBO.CLMITEM
);
"""
# Execute the query and get the DataFrame
df_climate2 = g_db_session.sql(query_climate).toPandas()
# df_climate2.drop_duplicates(subset=['FY']).sort_values(by=['FY'])
display(df_climate2)
| ORGPERMID | ADDRTYPECODE | ISPUBLIC | IPODATE | ISO2CNTRYCODE | LEGALNAME | ADDRLINE1 | ADDRLINE2 | CITY | STATEPROV | ... | TITLE | DESCRIPTION | DATATYPECODE | TABLECODE | HEIRARCHYCODE | UNITS | POLARITY | INCLUDEDINSCORES | PILLARITEM | CATITEM | |
| 0 | 5E+09 | 2 | TRUE | 29-05-15 | MA | TotalEnergies Marketing Maroc SA | 146, boulevard Zerktouni | CASABLANCA | GRAND CASABLANCA | ... | Short Term Set 1 Upstream Fuel and Energy Rela... | Short-Term Targets Set 1: Does the company rep... | 1 | 3 | 1 | Y/N | Not applicable | None | 4 | 1 | |
| 1 | 5E+09 | 1 | TRUE | 26-09-73 | FR | TotalEnergies SE | 2 Place Jean Millier | Paris la Defense cedex | PARIS | ILE-DE-FRANCE | ... | Long Term Set 2 Downstream Investments | Long-Term Targets Set 2: Does the company repo... | 1 | 3 | 1 | Y/N | Not applicable | None | 4 | 1 |
| ... | ... | ... | ... | ... | ... | ... | ... | ... | ... | ... | ... | ... | ... | ... | ... | ... | ... | ... | ... | ... | ... |
| 2724 | 5E+09 | 1 | TRUE | 26-09-73 | FR | TotalEnergies SE | 2 Place Jean Millier | Paris la Defense cedex | PARIS | ILE-DE-FRANCE | ... | Short Term Set 2 Upstream Other | Short-Term Targets Set 2: Does the company rep... | 1 | 3 | 1 | Y/N | Not applicable | None | 4 | 1 |
| 2725 | 5E+09 | 1 | TRUE | 26-09-73 | FR | TotalEnergies SE | 2 Place Jean Millier | Paris la Defense cedex | PARIS | ILE-DE-FRANCE | ... | Long Term Set 3 GHG Emission Target Type | Long-Term Targets Set 3: What is the long-term... | 6 | 3 | 1 | Name | Not applicable | None | 4 | 1 |
| 2726 rows × 37 columns | |||||||||||||||||||||
I can't see all the column names like this, let's look at the Transpose:
df_climate2
|
ORGPERMID | ADDRTYPECODE | ISPUBLIC | IPODATE | ISO2CNTRYCODE | LEGALNAME | ADDRLINE1 | ADDRLINE2 | CITY | STATEPROV | POSTALCODE | PRITRBCINDPERMID | CNTRYGEOID | ORGPERMID | ITEM | FY | VALUERECDT | UNITPCT | UNITPERMID | ISOCURRCODE | VALUE_ | VALUEDATE | VALUEFLG | VALUETEXT | VALUEPRCNT | ITEM | FEEDFIELDNAME | TITLE | DESCRIPTION | DATATYPECODE | TABLECODE | HEIRARCHYCODE | UNITS | POLARITY | INCLUDEDINSCORES | PILLARITEM | CATITEM |
| 0 | 5000180598 | 2 | TRUE | 29-05-15 00:00 | MA | TotalEnergies Marketing Maroc SA | 146, boulevard Zerktouni | CASABLANCA | GRAND CASABLANCA | 20000 | 4294951991 | 100197 | 5000180598 | 190 | 2022 | NaT | NaN | NaN | None | NaN | NaT | FALSE | None | NaN | 190 | ShortTermSet1UpstreamFuelandEnergyRelatedActiv... | Short Term Set 1 Upstream Fuel and Energy Rela... | Short-Term Targets Set 1: Does the company rep... | 1 | 3 | 1 | Y/N | Not applicable | None | 4 | 1 | |
| 1 | 5001170594 | 1 | TRUE | 26-09-73 00:00 | FR | TotalEnergies SE | 2 Place Jean Millier | Paris la Defense cedex | PARIS | ILE-DE-FRANCE | 92078 | 4294951998 | 100105 | 5001170594 | 287 | 2022 | NaT | NaN | NaN | None | NaN | NaT | FALSE | None | NaN | 287 | LongTermSet2DownstreamInvestments | Long Term Set 2 Downstream Investments | Long-Term Targets Set 2: Does the company repo... | 1 | 3 | 1 | Y/N | Not applicable | None | 4 | 1 |
| ... | ... | ... | ... | ... | ... | ... | ... | ... | ... | ... | ... | ... | ... | ... | ... | ... | ... | ... | ... | ... | ... | ... | ... | ... | ... | ... | ... | ... | ... | ... | ... | ... | ... | ... | ... | ... | ... |
| 2724 | 5001170594 | 1 | TRUE | 26-09-73 00:00 | FR | TotalEnergies SE | 2 Place Jean Millier | Paris la Defense cedex | PARIS | ILE-DE-FRANCE | 92078 | 4294951998 | 100105 | 5001170594 | 231 | 2022 | NaT | NaN | NaN | None | NaN | NaT | FALSE | None | NaN | 231 | ShortTermSet2UpstreamOther | Short Term Set 2 Upstream Other | Short-Term Targets Set 2: Does the company rep... | 1 | 3 | 1 | Y/N | Not applicable | None | 4 | 1 |
| 2725 | 5001170594 | 1 | TRUE | 26-09-73 00:00 | FR | TotalEnergies SE | 2 Place Jean Millier | Paris la Defense cedex | PARIS | ILE-DE-FRANCE | 92078 | 4294951998 | 100105 | 5001170594 | 327 | 2022 | 32:16.5 | NaN | NaN | None | NaN | NaT | None | Intensity | NaN | 327 | LongTermSet3GHGEmissionTargetType | Long Term Set 3 GHG Emission Target Type | Long-Term Targets Set 3: What is the long-term... | 6 | 3 | 1 | Name | Not applicable | None | 4 | 1 |
Looks like there are many duplicates; let's remove them, along with rows where ITEM and VALUEPRCNT are empty:
df_climate2.drop_duplicates().sort_values(by=['FY']).dropna(subset=['ITEM', 'VALUEPRCNT']).T
|
ORGPERMID | ADDRTYPECODE | ISPUBLIC | IPODATE | ISO2CNTRYCODE | LEGALNAME | ADDRLINE1 | ADDRLINE2 | CITY | STATEPROV | POSTALCODE | PRITRBCINDPERMID | CNTRYGEOID | ORGPERMID | ITEM | FY | VALUERECDT | UNITPCT | UNITPERMID | ISOCURRCODE | VALUE_ | VALUEDATE | VALUEFLG | VALUETEXT | VALUEPRCNT | ITEM | FEEDFIELDNAME | TITLE | DESCRIPTION | DATATYPECODE | TABLECODE | HEIRARCHYCODE | UNITS | POLARITY | INCLUDEDINSCORES | PILLARITEM | CATITEM |
| 2237 | 5001170594 | 2 | TRUE | 26-09-73 00:00 | FR | TotalEnergies SE | La Defense 6 | 2 Pl Jean Millier | COURBEVOIE | ILE-DE-FRANCE | 92400 | 4294951998 | 100105 | 5001170594 | 129 | 2017 | 06:29.7 | NaN | NaN | None | NaN | NaT | None | None | 80 | 129 | EmissionReductionTargetPercentage | Emission Reduction Target Percentage | Percentage of emission reduction target set by... | 3 | 3 | 1 | Percentage | Positive | None | 4 | 1 |
| 8 | 5001170594 | 1 | TRUE | 26-09-73 00:00 | FR | TotalEnergies SE | 2 Place Jean Millier | Paris la Defense cedex | PARIS | ILE-DE-FRANCE | 92078 | 4294951998 | 100105 | 5001170594 | 129 | 2017 | 06:29.7 | NaN | NaN | None | NaN | NaT | None | None | 80 | 129 | EmissionReductionTargetPercentage | Emission Reduction Target Percentage | Percentage of emission reduction target set by... | 3 | 3 | 1 | Percentage | Positive | None | 4 | 1 |
| ... | ... | ... | ... | ... | ... | ... | ... | ... | ... | ... | ... | ... | ... | ... | ... | ... | ... | ... | ... | ... | ... | ... | ... | ... | ... | ... | ... | ... | ... | ... | ... | ... | ... | ... | ... | ... | ... |
| 743 | 5000180598 | 2 | TRUE | 29-05-15 00:00 | MA | TotalEnergies Marketing Maroc SA | 146, boulevard Zerktouni | CASABLANCA | GRAND CASABLANCA | 20000 | 4294951991 | 100197 | 5000180598 | 269 | 2023 | 40:02.7 | NaN | NaN | None | NaN | NaT | None | None | 10000 | 269 | LongTermSet1GHGEmissionPercentageReductionTarg... | Long Term Set 1 GHG Emission Percentage Reduct... | Long-Term Targets Set 1: Long-term GHG emissio... | 3 | 3 | 1 | Percentage | Positive | None | 4 | 1 | |
| 742 | 5000180598 | 1 | TRUE | 29-05-15 00:00 | MA | TotalEnergies Marketing Maroc SA | 146, boulevard Zerktouni | CASABLANCA | GRAND CASABLANCA | 20000 | 4294951991 | 100197 | 5000180598 | 269 | 2023 | 40:02.7 | NaN | NaN | None | NaN | NaT | None | None | 10000 | 269 | LongTermSet1GHGEmissionPercentageReductionTarg... | Long Term Set 1 GHG Emission Percentage Reduct... | Long-Term Targets Set 1: Long-term GHG emissio... | 3 | 3 | 1 | Percentage | Positive | None | 4 | 1 |
'CO2e' and 'CO2e per Tonne of Revenue'
FEEDFIELDNAME ending with 'GHGEmissionCoveredbyTarget' show-case the amount that we are focussing on which we plan to reduce by a certain percentage, i.e.: if we reduce emissions by 50% on a target of 30%, in total we reduced by 15%, here the 'GHGEmissionCoveredbyTarget' is 30% and 'PercentageReductionTargeted' is 50% (such that 'PercentageReductionTargeted' is the amount by which it reduced).
This is all relative to the Scope; i.e.: in the example above, we reduced, in total, our 'Scope x' emissions by 15% for x = {1, 2, 3, 1&2, 1&2&3}.
To make things harder, this is all relative, also, to the value a company decides to focus on. In this article, we only focus on 2: 'CO2e' (i.e.: Tons Carbon Dioxide emissions) and 'CO2e per Tonne of Revenue' (i.e.: the Tons Carbon Dioxide emissions per million of revenue, say per 1 000 000 $ or 1 000 000 € of revenue).
We are only interested in 2 VALUETEXT, 'CO2' and 'CO2 Per Tonne of Revenue'. I happen to know that Microsoft has all types, so it's a good use case for now that encapsulates all permutations both in terms of VALUETEXT and Scope (we already know what columns are available in these tables as per the dataframe above, so let's only pick the ones we're after in lines 3 to 8):
query_climate = f"""
SELECT
c.FY, p.LEGALNAME, p.ORGPERMID, c.VALUEPRCNT,
k.ITEM, c.VALUE_, k.INCLUDEDINSCORES,
k.POLARITY, k.UNITS, k.TABLECODE,
k.DATATYPECODE, k.DESCRIPTION,
k.TITLE, k.FEEDFIELDNAME, c.VALUEPRCNT,
c.VALUETEXT, c.VALUEFLG, c.VALUEDATE
FROM
SHAREDB_SFI_MVP.DBO.PERMORGINFO p
JOIN
SFI_MASTER_MVP.DBO.CLMDataPoint c
ON p.ORGPERMID = c.ORGPERMID
JOIN
SFI_MASTER_MVP.DBO.CLMITEM k
ON c.ITEM = k.ITEM
WHERE
p.LEGALNAME ILIKE '%Microsoft%'
AND c.ITEM IN (
SELECT ITEM
FROM SFI_MASTER_MVP.DBO.CLMITEM
WHERE (VALUETEXT = 'CO2' OR VALUETEXT = 'CO2 Per Tonne of Revenue') -- This line makes sure we only have 'CO2' OR 'CO2 Per Tonne of Revenue' publishing companies
);
"""
df_climate3 = g_db_session.sql(query_climate).toPandas()
display(df_climate3)
|
FY | LEGALNAME | ORGPERMID | VALUEPRCNT | ITEM | VALUE_ | INCLUDEDINSCORES | POLARITY | UNITS | TABLECODE | DATATYPECODE | DESCRIPTION | TITLE | FEEDFIELDNAME | VALUEPRCNT | VALUETEXT | VALUEFLG | VALUEDATE |
| 0 | 2020 | MICROSOFT CORPORATION | 4295907168 | NaN | 354 | NaN | None | Not applicable | Name | 3 | 6 | Long-Term Targets Set 4: What is the long-term... | Long Term Set 4 GHG Emission Target Unit | LongTermSet4GHGEmissionTargetUnit | NaN | CO2 | None | NaT |
| 1 | 2020 | MICROSOFT CORPORATION | 4295907168 | NaN | 354 | NaN | None | Not applicable | Name | 3 | 6 | Long-Term Targets Set 4: What is the long-term... | Long Term Set 4 GHG Emission Target Unit | LongTermSet4GHGEmissionTargetUnit | NaN | CO2 | None | NaT |
| ... | ... | ... | ... | ... | ... | ... | ... | ... | ... | ... | ... | ... | ... | ... | ... | ... | ... | ... |
| 30 | 2022 | MICROSOFT CORPORATION | 4295907168 | NaN | 382 | NaN | None | Not applicable | Name | 3 | 6 | Long-Term Targets Set 5: What is the long-term... | Long Term Set 5 GHG Emission Target Unit | LongTermSet5GHGEmissionTargetUnit | NaN | CO2 | None | NaT |
| 31 | 2022 | MICROSOFT CORPORATION | 4295907168 | NaN | 382 | NaN | None | Not applicable | Name | 3 | 6 | Long-Term Targets Set 5: What is the long-term... | Long Term Set 5 GHG Emission Target Unit | LongTermSet5GHGEmissionTargetUnit | NaN | CO2 | None | NaT |
df_climate3.VALUETEXT.unique()
array(['CO2', 'CO2 Per Tonne of Revenue'], dtype=object)
'CO2e'
We can access different datasets related to companies GHG emissions:
- LSEG D&A: Detailed climate data collected, quality controlled and normalized by LSEG from companies' public disclosures, including the auditability back to source documents
- CDP: Climate data as provided by the companies in response to CDP annual survey
- Combined: “Combined” dataset is gathering LSEG data, CDP data and Estimated data based on our robust proprietary multi model estimation approach to provide the best available data for each company. Reported data can be discarded due to additional quality checks (including materiality filter for Scope 3).
For the present use case, as we’re relying on targets disclosed by the companies and collected by our analysts, let’s focus on LSEG D&A reported data.
Depending on the scope of the target (1, 2, 3, 1+2 or 1+2+3) and the unit (CO2e or CO2e per tonne of revenues), we won’t rely on the same datapoint to compute our analysis. The table below shows the direct datapoints to be used (LSEG Workspace code as well as LSEG Data Platform Bulk Field Names):
| CO2 'Workspace Code' | CO2 'Data Platform Bulk Field Names' | CO2 per Tonne of Revenue 'Workspace Code' | CO2 per Tonne of Revenue 'Data Platform Bulk Field Names' | |
| Scope 1 | TR.CO2DirectScope1 | CO2EquivalentsEmissionDirectScope1 | TR.AnalyticGHGEmissionsDirectScope1 | GHGEmissionsDirectScope1toRevenue |
| Scope 2 | TR.CO2IndirectScope2 | CO2EquivalentsEmissionIndirectScope2 | TR.AnalyticGHGEmissionsIndirectScope2 | GHGEmissionsIndirectScope2toRevenue |
| Scope 3 | TR.CO2IndirectScope3 | CO2EquivalentsEmissionIndirectScope3 | TR.AnalyticCO2IndirectScope3 | Scope3ToRevenues |
| Scope 1 and 2 | TR.CO2EmissionTotal | CO2EquivalentsEmissionTotal | TR.AnalyticCO2 | TotalCO2EquivalentsEmissionsToRevenues |
| Scope 1 and 2 and 3 | TR.TotalCO2EquivalentEmissionsScope1and2and3 | TotalCO2EquivalentEmissionsScope1andScope2andScope3 | TR.AnalyticGHGEmissionsScope1and2and3 | GHGEmissionsScope1andScope2andScope3toRevenue |
Let's focus on one use-case for this article; the Reported Direct companies that publish Long Term Set 1 GHG (green house gasses) Emissions; let's also only get the data poits we're interested in, listed in FEEDFIELDNAME_of_interest
FEEDFIELDNAME_of_interest = ['CO2EquivalentsEmissionDirectScope1', 'CO2EquivalentsEmissionIndirectScope2', 'CO2EquivalentsEmissionIndirectScope3', 'CO2EquivalentsEmissionTotal', 'TotalCO2EquivalentEmissionsScope1andScope2andScope3']
FEEDFIELDNAME_of_interest_SQL_str = ' OR '.join([f"(FEEDFIELDNAME = '{i}')" for i in FEEDFIELDNAME_of_interest])
FEEDFIELDNAME_of_interest_SQL_str
"(FEEDFIELDNAME = 'CO2EquivalentsEmissionDirectScope1') OR (FEEDFIELDNAME = 'CO2EquivalentsEmissionIndirectScope2') OR (FEEDFIELDNAME = 'CO2EquivalentsEmissionIndirectScope3') OR (FEEDFIELDNAME = 'CO2EquivalentsEmissionTotal') OR (FEEDFIELDNAME = 'TotalCO2EquivalentEmissionsScope1andScope2andScope3')"
query_climate = f"""
SELECT
c.FY, p.LEGALNAME, p.ORGPERMID,
k.ITEM, k.INCLUDEDINSCORES,
k.POLARITY, k.UNITS, k.TABLECODE,
k.DATATYPECODE, k.DESCRIPTION,
k.TITLE, k.FEEDFIELDNAME, c.VALUE_,
c.VALUEPRCNT, c.VALUETEXT,
c.VALUEFLG, c.VALUEDATE
FROM
SHAREDB_SFI_MVP.DBO.PERMORGINFO p
JOIN
SFI_MASTER_MVP.DBO.CLMDataPoint c
ON p.ORGPERMID = c.ORGPERMID
JOIN
SFI_MASTER_MVP.DBO.CLMITEM k
ON c.ITEM = k.ITEM
WHERE
p.LEGALNAME ILIKE '%Microsoft%'
AND c.ITEM IN (
SELECT ITEM
FROM SFI_MASTER_MVP.DBO.CLMITEM
WHERE {FEEDFIELDNAME_of_interest_SQL_str}
);
"""
df_climate4 = g_db_session.sql(query_climate).toPandas()
df_climate4.head(3)
| FY | LEGALNAME | ORGPERMID | ITEM | INCLUDEDINSCORES | POLARITY | UNITS | TABLECODE | DATATYPECODE | DESCRIPTION | TITLE | FEEDFIELDNAME | VALUE_ | VALUEPRCNT | VALUETEXT | VALUEFLG | VALUEDATE | |
| 0 | 2010 | MICROSOFT CORPORATION | 4295907168 | 12 | None | Negative | Tonnes | 3 | 3 | Indirect of CO2 and CO2 equivalents emission i... | CO2 Equivalent Emissions Indirect, Scope 2 | CO2EquivalentsEmissionIndirectScope2 | 1035385 | NaN | None | None | NaT |
| 1 | 2010 | MICROSOFT CORPORATION | 4295907168 | 12 | None | Negative | Tonnes | 3 | 3 | Indirect of CO2 and CO2 equivalents emission i... | CO2 Equivalent Emissions Indirect, Scope 2 | CO2EquivalentsEmissionIndirectScope2 | 1035385 | NaN | None | None | NaT |
| 2 | 2013 | MICROSOFT CORPORATION | 4295907168 | 11 | None | Negative | Tonnes | 3 | 3 | Direct of CO2 and CO2 equivalents emission in ... | CO2 Equivalent Emissions Direct, Scope 1 | CO2EquivalentsEmissionDirectScope1 | 78116 | NaN | None | None | NaT |
df_climate4.pivot_table(
index='FY',
columns='FEEDFIELDNAME',
values=['VALUE_', 'VALUEPRCNT', 'VALUEFLG', 'VALUEDATE', 'VALUETEXT'],
aggfunc={
'VALUE_': 'sum', # for numeric columns, we can use sum, mean, etc.
'VALUEPRCNT': 'mean',
'VALUEFLG': 'sum',
'VALUEDATE': 'first', # Assuming we want the first value in each group
'VALUETEXT': 'first'
}
)
| VALUEFLG | VALUE_ | |||||||||
| FEEDFIELDNAME | CO2EquivalentsEmissionDirectScope1 | CO2EquivalentsEmissionIndirectScope2 | CO2EquivalentsEmissionIndirectScope3 | CO2EquivalentsEmissionTotal | TotalCO2EquivalentEmissionsScope1andScope2andScope3 | CO2EquivalentsEmissionDirectScope1 | CO2EquivalentsEmissionIndirectScope2 | CO2EquivalentsEmissionIndirectScope3 | CO2EquivalentsEmissionTotal | TotalCO2EquivalentEmissionsScope1andScope2andScope3 |
| FY | ||||||||||
| 2005 | 0 | 0 | NaN | 0 | NaN | 26370 | 483460 | NaN | 509830 | NaN |
| 2006 | 0 | 0 | NaN | 0 | NaN | 29460 | 275740 | NaN | 305200 | NaN |
| … | … | … | … | … | … | … | … | … | … | … |
| 2021 | 0 | 0 | 0 | 0 | 0 | 247408 | 10021340 | 25022000 | 10268740 | 36311144 |
| 2022 | 0 | 0 | 0 | 0 | 0 | 278826 | 12762500 | 25142000 | 13041320 | 39665326 |
Clearly, the item of interest here is 'VALUE_':
_df_climate = df_climate4.pivot_table(
index='FY',
columns='FEEDFIELDNAME',
values=['VALUE_'])['VALUE_']
_df_climate
| FEEDFIELDNAME | CO2EquivalentsEmissionDirectScope1 | CO2EquivalentsEmissionIndirectScope2 | CO2EquivalentsEmissionIndirectScope3 | CO2EquivalentsEmissionTotal | TotalCO2EquivalentEmissionsScope1andScope2andScope3 |
| FY | |||||
| 2005 | 13185 | 241730 | NaN | 254915 | NaN |
| 2006 | 14730 | 137870 | NaN | 152600 | NaN |
| … | … | … | … | … | … |
| 2021 | 123704 | 5010670 | 12511000 | 5134370 | 18155572 |
| 2022 | 139413 | 6381250 | 12571000 | 6520660 | 19832663 |
let's add the 'GHGEmissionCoveredbyTarget' and the 'PercentageReductionTargeted' as well as the LongTermSet1GHGEmissionScope, LongTermSet2GHGEmissionScope, ...
query_climate = f"""
SELECT
c.FY, p.LEGALNAME, p.ORGPERMID, c.VALUEPRCNT,
k.ITEM, c.VALUE_, k.INCLUDEDINSCORES,
k.POLARITY, k.UNITS, k.TABLECODE,
k.DATATYPECODE, k.DESCRIPTION,
k.TITLE, k.FEEDFIELDNAME, c.VALUEPRCNT,
c.VALUETEXT, c.VALUEFLG, c.VALUEDATE
FROM
SHAREDB_SFI_MVP.DBO.PERMORGINFO p
JOIN
SFI_MASTER_MVP.DBO.CLMDataPoint c
ON p.ORGPERMID = c.ORGPERMID
JOIN
SFI_MASTER_MVP.DBO.CLMITEM k
ON c.ITEM = k.ITEM
WHERE
p.LEGALNAME ILIKE '%Microsoft%'
AND c.ITEM IN (
SELECT ITEM
FROM SFI_MASTER_MVP.DBO.CLMITEM
WHERE (
FEEDFIELDNAME ILIKE '%GHGEmissionCoveredbyTarget%')
OR (FEEDFIELDNAME ILIKE '%PercentageReductionTargeted%')
OR (FEEDFIELDNAME ILIKE '%LongTermSet%GHGEmissionScope%')
OR (FEEDFIELDNAME ILIKE '%LongTermSet%GHGEmissionBaseYear%')
OR (FEEDFIELDNAME ILIKE '%LongTermSet%GHGEmissionTargetYear%')
OR (FEEDFIELDNAME ILIKE '%CO2EquivalentEmissionsTotalMarketbased%')
);
"""
df_climate5 = g_db_session.sql(query_climate).toPandas()
Let's keep track of the LEGALNAME
legalName = df_climate5.LEGALNAME.iloc[0]
legalName
'MICROSOFT CORPORATION'
We're are interested in VALUETEXT figures because they let us know which Scopes we focus on for each emission data point.
We also need the base year from which we do our calculation, i.e.: when is the emission reduction calculated from? FEEDFIELDNAME ILIKE '%LongTermSet%GHGEmissionBaseYear%' fetches just this info. We can collect it via The VALUE_ values.
We also need the aim year from which we do our calculation, i.e.: when is the emission reduction set to be done by? FEEDFIELDNAME ILIKE '%LongTermSet%GHGEmissionTargetYear%' fetches just this info. We can collect it via The VALUE_ values.
The VALUEPRCNT values are the others we're interested in.
Let's concatenate all data in an easy-to-use dataframe df_climate6:
df_climate6 = pd.concat(
[
df_climate5.pivot_table(
index='FY',
columns='FEEDFIELDNAME',
values=['VALUEPRCNT'],
),
df_climate5.pivot_table(
index='FY',
columns='FEEDFIELDNAME',
values=['VALUETEXT'],
aggfunc={
'VALUETEXT': 'first'
}
),
df_climate5.pivot_table(
index='FY',
columns='FEEDFIELDNAME',
values=['VALUE_'],
)
],
axis=1)
df_climate6
| VALUEPRCNT | ... | VALUE_ | |||||||||||||||||||
| FEEDFIELDNAME | LongTermSet1GHGEmissionPercentageReductionTargeted | LongTermSet1PercentageofGHGEmissionCoveredbyTarget | LongTermSet2GHGEmissionPercentageReductionTargeted | LongTermSet2PercentageofGHGEmissionCoveredbyTarget | LongTermSet3GHGEmissionPercentageReductionTargeted | LongTermSet3PercentageofGHGEmissionCoveredbyTarget | LongTermSet4GHGEmissionPercentageReductionTargeted | LongTermSet4PercentageofGHGEmissionCoveredbyTarget | LongTermSet5GHGEmissionPercentageReductionTargeted | LongTermSet5PercentageofGHGEmissionCoveredbyTarget | ... | LongTermSet1GHGEmissionBaseYear | LongTermSet1GHGEmissionTargetYear | LongTermSet2GHGEmissionBaseYear | LongTermSet2GHGEmissionTargetYear | LongTermSet3GHGEmissionBaseYear | LongTermSet3GHGEmissionTargetYear | LongTermSet4GHGEmissionBaseYear | LongTermSet4GHGEmissionTargetYear | LongTermSet5GHGEmissionBaseYear | LongTermSet5GHGEmissionTargetYear |
| FY | |||||||||||||||||||||
| 2019 | 7500 | 10000 | 7500 | 10000 | NaN | NaN | NaN | NaN | NaN | NaN | ... | 2013 | 2045 | 2013 | 2030 | NaN | NaN | NaN | NaN | NaN | NaN |
| 2020 | 7500 | 10000 | 7500 | 10000 | 3000 | 10000 | 5000 | 10000 | NaN | NaN | ... | 2013 | 2045 | 2013 | 2030 | 2017 | 2030 | 2020 | 2030 | NaN | NaN |
| 2021 | 7500 | 10000 | 7500 | 10000 | 3000 | 10000 | 5000 | 10000 | NaN | NaN | ... | 2013 | 2045 | 2013 | 2030 | 2017 | 2030 | 2020 | 2030 | NaN | NaN |
| 2022 | 7500 | 10000 | 7500 | 10000 | 3000 | 10000 | 10000 | NaN | 5000 | 10000 | ... | 2013 | 2045 | 2013 | 2030 | 2017 | 2030 | 2020 | 2030 | 2020 | 2030 |
for col in df_climate6.VALUEPRCNT.columns:
_df_climate[col] = df_climate6.VALUEPRCNT[col].iloc[:,0]
for col in df_climate6.VALUETEXT.columns:
_df_climate[col] = df_climate6.VALUETEXT[col]
for col in df_climate6.VALUE_.columns:
_df_climate[col] = df_climate6.VALUE_[col]
_df_climate
| FEEDFIELDNAME | CO2EquivalentsEmissionDirectScope1 | CO2EquivalentsEmissionIndirectScope2 | CO2EquivalentsEmissionIndirectScope3 | CO2EquivalentsEmissionTotal | TotalCO2EquivalentEmissionsScope1andScope2andScope3 | LongTermSet1GHGEmissionPercentageReductionTargeted | LongTermSet1PercentageofGHGEmissionCoveredbyTarget | LongTermSet2GHGEmissionPercentageReductionTargeted | LongTermSet2PercentageofGHGEmissionCoveredbyTarget | LongTermSet3GHGEmissionPercentageReductionTargeted | ... | LongTermSet1GHGEmissionBaseYear | LongTermSet1GHGEmissionTargetYear | LongTermSet2GHGEmissionBaseYear | LongTermSet2GHGEmissionTargetYear | LongTermSet3GHGEmissionBaseYear | LongTermSet3GHGEmissionTargetYear | LongTermSet4GHGEmissionBaseYear | LongTermSet4GHGEmissionTargetYear | LongTermSet5GHGEmissionBaseYear | LongTermSet5GHGEmissionTargetYear |
| FY | |||||||||||||||||||||
| 2005 | 13185 | 241730 | NaN | 254915 | NaN | NaN | NaN | NaN | NaN | NaN | ... | NaN | NaN | NaN | NaN | NaN | NaN | NaN | NaN | NaN | NaN |
| 2006 | 14730 | 137870 | NaN | 152600 | NaN | NaN | NaN | NaN | NaN | NaN | ... | NaN | NaN | NaN | NaN | NaN | NaN | NaN | NaN | NaN | NaN |
| … | … | … | … | … | … | … | … | … | … | … | … | … | … | … | … | … | … | … | … | … | … |
| 2021 | 123704 | 5010670 | 12511000 | 5134370 | 18155572 | 7500 | 10000 | 7500 | 10000 | 3000 | ... | 2013 | 2045 | 2013 | 2030 | 2017 | 2030 | 2020 | 2030 | NaN | NaN |
| 2022 | 139413 | 6381250 | 12571000 | 6520660 | 19832663 | 7500 | 10000 | 7500 | 10000 | 3000 | ... | 2013 | 2045 | 2013 | 2030 | 2017 | 2030 | 2020 | 2030 | 2020 | 2030 |
Some of the values are pre-multiplied by 100 when it's a percentage. I'm personally not a fan of that, so let's scale it back to 100 as a maximum:
for col in _df_climate.columns:
# Check if column name contains the target substrings
if ('GHGEmissionPercentageReductionTargeted' in col or 'GHGEmissionCoveredbyTarget' in col):
# Select the column and check if all numeric values (ignoring NaNs) are greater than 100
if _df_climate[col].apply(pd.to_numeric, errors='coerce').dropna().gt(100).all():
# If condition is met, divide the values by 100
_df_climate[col] = _df_climate[col] / 100
_df_climate
| FEEDFIELDNAME | CO2EquivalentsEmissionDirectScope1 | CO2EquivalentsEmissionIndirectScope2 | CO2EquivalentsEmissionIndirectScope3 | CO2EquivalentsEmissionTotal | TotalCO2EquivalentEmissionsScope1andScope2andScope3 | LongTermSet1GHGEmissionPercentageReductionTargeted | LongTermSet1PercentageofGHGEmissionCoveredbyTarget | LongTermSet2GHGEmissionPercentageReductionTargeted | LongTermSet2PercentageofGHGEmissionCoveredbyTarget | LongTermSet3GHGEmissionPercentageReductionTargeted | ... | LongTermSet1GHGEmissionBaseYear | LongTermSet1GHGEmissionTargetYear | LongTermSet2GHGEmissionBaseYear | LongTermSet2GHGEmissionTargetYear | LongTermSet3GHGEmissionBaseYear | LongTermSet3GHGEmissionTargetYear | LongTermSet4GHGEmissionBaseYear | LongTermSet4GHGEmissionTargetYear | LongTermSet5GHGEmissionBaseYear | LongTermSet5GHGEmissionTargetYear |
| FY | |||||||||||||||||||||
| 2005 | 13185 | 241730 | NaN | 254915 | NaN | NaN | NaN | NaN | NaN | NaN | ... | NaN | NaN | NaN | NaN | NaN | NaN | NaN | NaN | NaN | NaN |
| 2006 | 14730 | 137870 | NaN | 152600 | NaN | NaN | NaN | NaN | NaN | NaN | ... | NaN | NaN | NaN | NaN | NaN | NaN | NaN | NaN | NaN | NaN |
| ... | ... | ... | ... | ... | ... | ... | ... | ... | ... | ... | ... | ... | ... | ... | ... | ... | ... | ... | ... | ... | ... |
| 2021 | 123704 | 5010670 | 12511000 | 5134370 | 18155572 | 75 | 100 | 75 | 100 | 30 | ... | 2013 | 2045 | 2013 | 2030 | 2017 | 2030 | 2020 | 2030 | NaN | NaN |
| 2022 | 139413 | 6381250 | 12571000 | 6520660 | 19832663 | 75 | 100 | 75 | 100 | 30 | ... | 2013 | 2045 | 2013 | 2030 | 2017 | 2030 | 2020 | 2030 | 2020 | 2030 |
For Your information (FYI): CO2EquivalentsEmissionTotal stands for TotalCO2EquivalentEmissionsScope1andScope2. As we can see in the far right of _df_climate, Scope1 & Scope2 seems the most popular, surely because that’s where companies have operational control; let's stick with that. Let's also choose 'Set 1' for this article, but you can choose whichever suits your needs.
df_climate = _df_climate[[
"CO2EquivalentsEmissionDirectScope1",
"CO2EquivalentsEmissionIndirectScope2",
"CO2EquivalentsEmissionTotal"]]
for col in ["CO2EquivalentEmissionsTotalMarketbased",
"LongTermSet1GHGEmissionPercentageReductionTargeted",
"LongTermSet1PercentageofGHGEmissionCoveredbyTarget",
"LongTermSet1GHGEmissionBaseYear",
"LongTermSet1GHGEmissionTargetYear"]:
df_climate[col] = _df_climate[_df_climate['LongTermSet1GHGEmissionScope'] == "Scope 1 and 2"][col]
df_climate
| FEEDFIELDNAME | CO2EquivalentsEmissionDirectScope1 | CO2EquivalentsEmissionIndirectScope2 | CO2EquivalentsEmissionTotal | CO2EquivalentEmissionsTotalMarketbased | LongTermSet1GHGEmissionPercentageReductionTargeted | LongTermSet1PercentageofGHGEmissionCoveredbyTarget | LongTermSet1GHGEmissionBaseYear | LongTermSet1GHGEmissionTargetYear |
| FY | ||||||||
| 2005 | 13185 | 241730 | 254915 | NaN | NaN | NaN | NaN | NaN |
| 2006 | 14730 | 137870 | 152600 | NaN | NaN | NaN | NaN | NaN |
| … | … | … | … | … | … | … | … | … |
| 2021 | 123704 | 5010670 | 5134370 | 553109 | 75 | 100 | 2013 | 2045 |
| 2022 | 139413 | 6381250 | 6520660 | 427442 | 75 | 100 | 2013 | 2045 |
if not df_climate['LongTermSet1PercentageofGHGEmissionCoveredbyTarget'].apply(pd.to_numeric, errors='coerce').dropna().gt(80).all():
print("Be weary of the fact that 'GHGEmissionCoveredbyTarget' is below 80%. The lower this figure, the less reliable the results.")
else:
print("'GHGEmissionCoveredbyTarget' figures are above 80%. The higher this figure, the more reliable the results.")
print("In this case, we consider them to be high enough to be considered reliable.")
'GHGEmissionCoveredbyTarget' figures are above 80%. The higher this figure, the more reliable the results.
In this case, we consider them to be high enough to be considered reliable.
So, let's recap; the base emission is baseEmission and the target is targetEmission to be archeved by 2045:
baseEmissionYear = int(df_climate.LongTermSet1GHGEmissionBaseYear.iloc[-1])
targetEmissionReductionYear = int(df_climate.LongTermSet1GHGEmissionTargetYear.iloc[-1])
baseEmission = _df_climate.loc[baseEmissionYear].CO2EquivalentsEmissionTotal
targetReductionEmission = baseEmission * (df_climate['LongTermSet1GHGEmissionPercentageReductionTargeted'].iloc[-1] / 100) * (df_climate['LongTermSet1PercentageofGHGEmissionCoveredbyTarget'].iloc[-1] / 100)
targetEmission = baseEmission - targetReductionEmission
print(f"baseEmissionYear = {baseEmissionYear} & targetEmissionReductionYear = {targetEmissionReductionYear}")
print(f"baseEmission = {baseEmission} & targetReductionEmission = {targetReductionEmission} & targetEmission = {targetEmission}")
baseEmissionYear = 2013 & targetEmissionReductionYear = 2045
baseEmission = 1355480.0 & targetReductionEmission = 1016610.0 & targetEmission = 338870.0
It's always best to see it all in a pretty graph:
Exponential Decay Line Plot Explanation
To create an exponential decay plot, we use the following exponential decay function:
Steps:
Calculate the Decay Constant 𝑘 : We first calculate the decay constant 𝑘 based on the start and end values (1,355,480.0 at 2013 and 338,870.0 at 2045). We use the following formula for exponential decay:
This formula is derived by solving for 𝑘 in the exponential decay equation, where 𝑦_end is the value at the end year (2045), 𝑦_0 is the starting value (2013), and 𝑡end is the end year.
Generate the Exponential Values: With 𝑘 calculated, we use the exponential decay equation to generate values for each year between 2013 and 2045:
This generates values that decrease exponentially from 1,355,480.0 in 2013 to 338,870.0 in 2045.
start_year = baseEmissionYear
end_year = targetEmissionReductionYear
start_value = baseEmission
end_value = targetEmission
# Calculate the decay constant 'k' for exponential decay
# We use the formula for exponential decay: y(t) = y0 * exp(-k * (t - t0))
# Solve for 'k' using y(t) at the end point
k = -np.log(end_value / start_value) / (end_year - start_year)
# Generate years and corresponding values using exponential decay
years = np.arange(start_year, end_year + 1)
values = start_value * np.exp(-k * (years - start_year))
# Create the plot
fig = go.Figure()
# Add the line trace
fig.add_trace(
go.Scatter(
x=years, y=values, mode='lines',
name=f'Exponential Decay to target of {int(targetEmission)}'))
# Set plot title and labels
fig.update_layout(
title=f"{legalName}'s GHG Emissions (Base in {baseEmissionYear} and Target in {targetEmissionReductionYear}) in CO2 Tons",
xaxis_title="Year",
yaxis_title="Value",
template="plotly_dark" # Optional: You can use different templates, such as 'plotly', 'ggplot2', etc.
)
# Add the dots representing the actual CO2 data from df_clmt0
fig.add_trace(go.Scatter(
x=df_climate.index,
y=df_climate["CO2EquivalentsEmissionTotal"],
mode='lines+markers',
name='CO2 Equivalents Emission Total',
marker=dict(color='red', size=8) # Customize the dot color and size
))
fig.add_trace(go.Scatter(
x=df_climate.index,
y=df_climate["CO2EquivalentEmissionsTotalMarketbased"],
mode='lines+markers',
name='CO2 Equivalent Emissions Total Marketbased',
marker=dict(color='grey', size=8) # Customize the dot color and size
))
# Show the plot
fig.show()

All together now
You can find the whole code on GitHub in the link at the top of this articel.
dfDict = GHGEmissionsBaseVsTargetUsingLSEGSFISnowflake(
g_db_session=g_db_session,
companyLegalName="Shell",
exactCompanyLegalName=False)
'GHGEmissionCoveredbyTarget' figures are above 80%. The higher this figure, the more reliable the results.
In this case, we consider them to be high enough to be considered reliable.
baseEmissionYear = 2016 & targetEmissionReductionYear = 2050
baseEmission = 83000000.0 & targetReductionEmission = 83000000.0 & targetEmission = 0.0

Conclusion
As you can see, once you know the name of the fields you are after, it becomes a simple matter of mix and match which SQL, along with Snowflake, can do for you! The code above is not fool-proof, and is not to be used in live environment, but it's a great example of how one can created automated processes allowing for anyone to gather insight behind SFI data and output useful graphics.
