


This article is an update version of my old How to integrate Financial Data from LSEG to Excel with Xlwings - Part 2 project because that library is outdated. This updated article aims to use the strategic LSEG Data Library for Python with the Workspace platform.
This article is the second part of the series that demonstrate how to export financial data and report from LSEG Workspace platform to Excel report file using xlwings CE and xlwings Pro libraries. The demo applications use content from Workspace desktop application via the the ease-of-use Data Library for Python as an example dataset. If you are not familiar with xlwings library or xlwings CE, please see more detail on first part article.
This second article is focusing on xlwings Reports and PDF features.
Re-Introduction to xlwings
Let’s start with an overview of the xlwings library. The xlwings is a Python library that makes it easy to call Python from Excel and vice versa on Windows and macOS. The library lets you automate Excel from Python source code to produce reports or to interact with Jupyter notebook applications. It also allows you to replace VBA macros with Python Code or write UDFs (user defined functions - Windows only).
- The xlwings CE is a free and open-source library (BSD-licensed) which provides basic functionalities to lets developers integrate Python with Excel.
- The xlwings PRO provides more advance features such as reports, embedded Python code in Excel, one-click installers for easy deployment, video training, dedicated support and much more.
Note:
- This article is based on xlwings version 0.33.9 and Python version 3.10.10.
That covers the basic of xlwings.
Re-Introduction to the Data Library for Python
Now let me turn to the Data Library. The Data Library for Python provides a set of ease-of-use interfaces offering coders uniform access to the breadth and depth of financial data and services available on the Workspace, RDP, and Real-Time Platforms. The API is designed to provide consistent access through multiple access channels and target both Professional Developers and Financial Coders. Developers can choose to access content from the desktop, through their deployed streaming services, or directly to the cloud. With the Data Library, the same Python code can be used to retrieve data regardless of which access point you choose to connect to the platform.
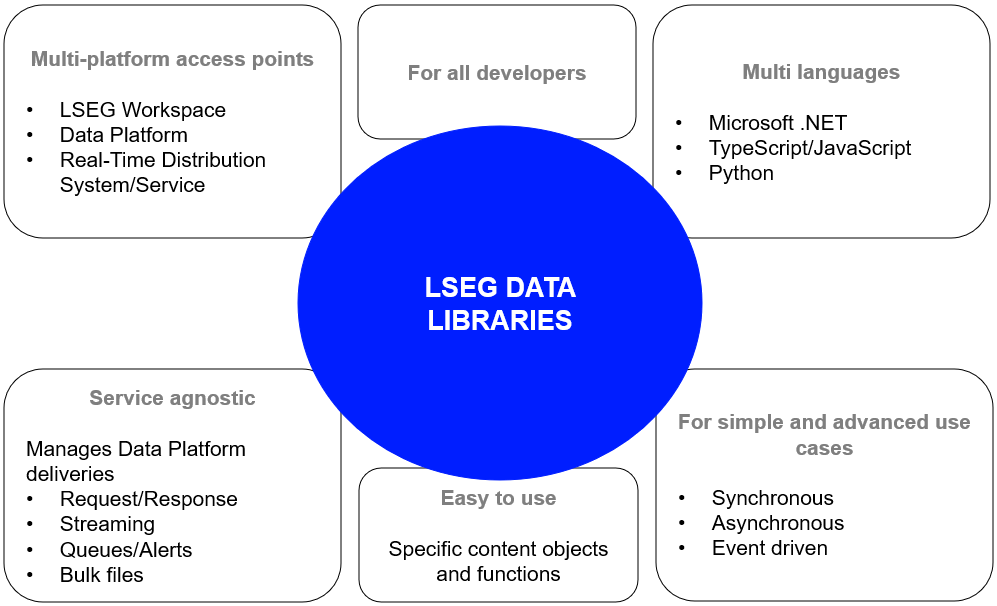
The Data Library are available in the following programming languages:
For more deep detail regarding the Data Library for Python, please refer to the following articles and tutorials:
Disclaimer
This article is based on Data Library Python versions 2.0.1 using the Desktop Session only.
That’s all I have to say about the Data Library.
Introduction to xlwings Reports
The xlwings Reports is part of xlwings PRO and a solution for template-based Excel and PDF reporting. The xlwings Reports let business users design and maintain their reports directly within Excel without being dependent on a dedicated reporting team or Python programmer.
The main features of the xlwings Reports are the following:
- Separation of code and design: Users without coding skills can change the template on their own without having to touch the Python code.
- Template variables: Python variables (between curly braces) can be directly used in cells, e.g. {{ title }}. They act as placeholders that will be replaced by the actual values.
- Frames for dynamic tables: Frames are vertical containers that dynamically align and style tables that have a variable number of rows.
You can get a free trial for xlwings PRO here, then follow the instruction on How to activate xlwings PRO and License Key pages.
TSMC vs GlobalFoundries Report Template Preparation
So, I will start off with report template preparation. I use TSMC (RIC: 2330.TW) and GlobalFounderies (RIC: GFO.O) stock price comparison as example data for this xlwings Reports file.
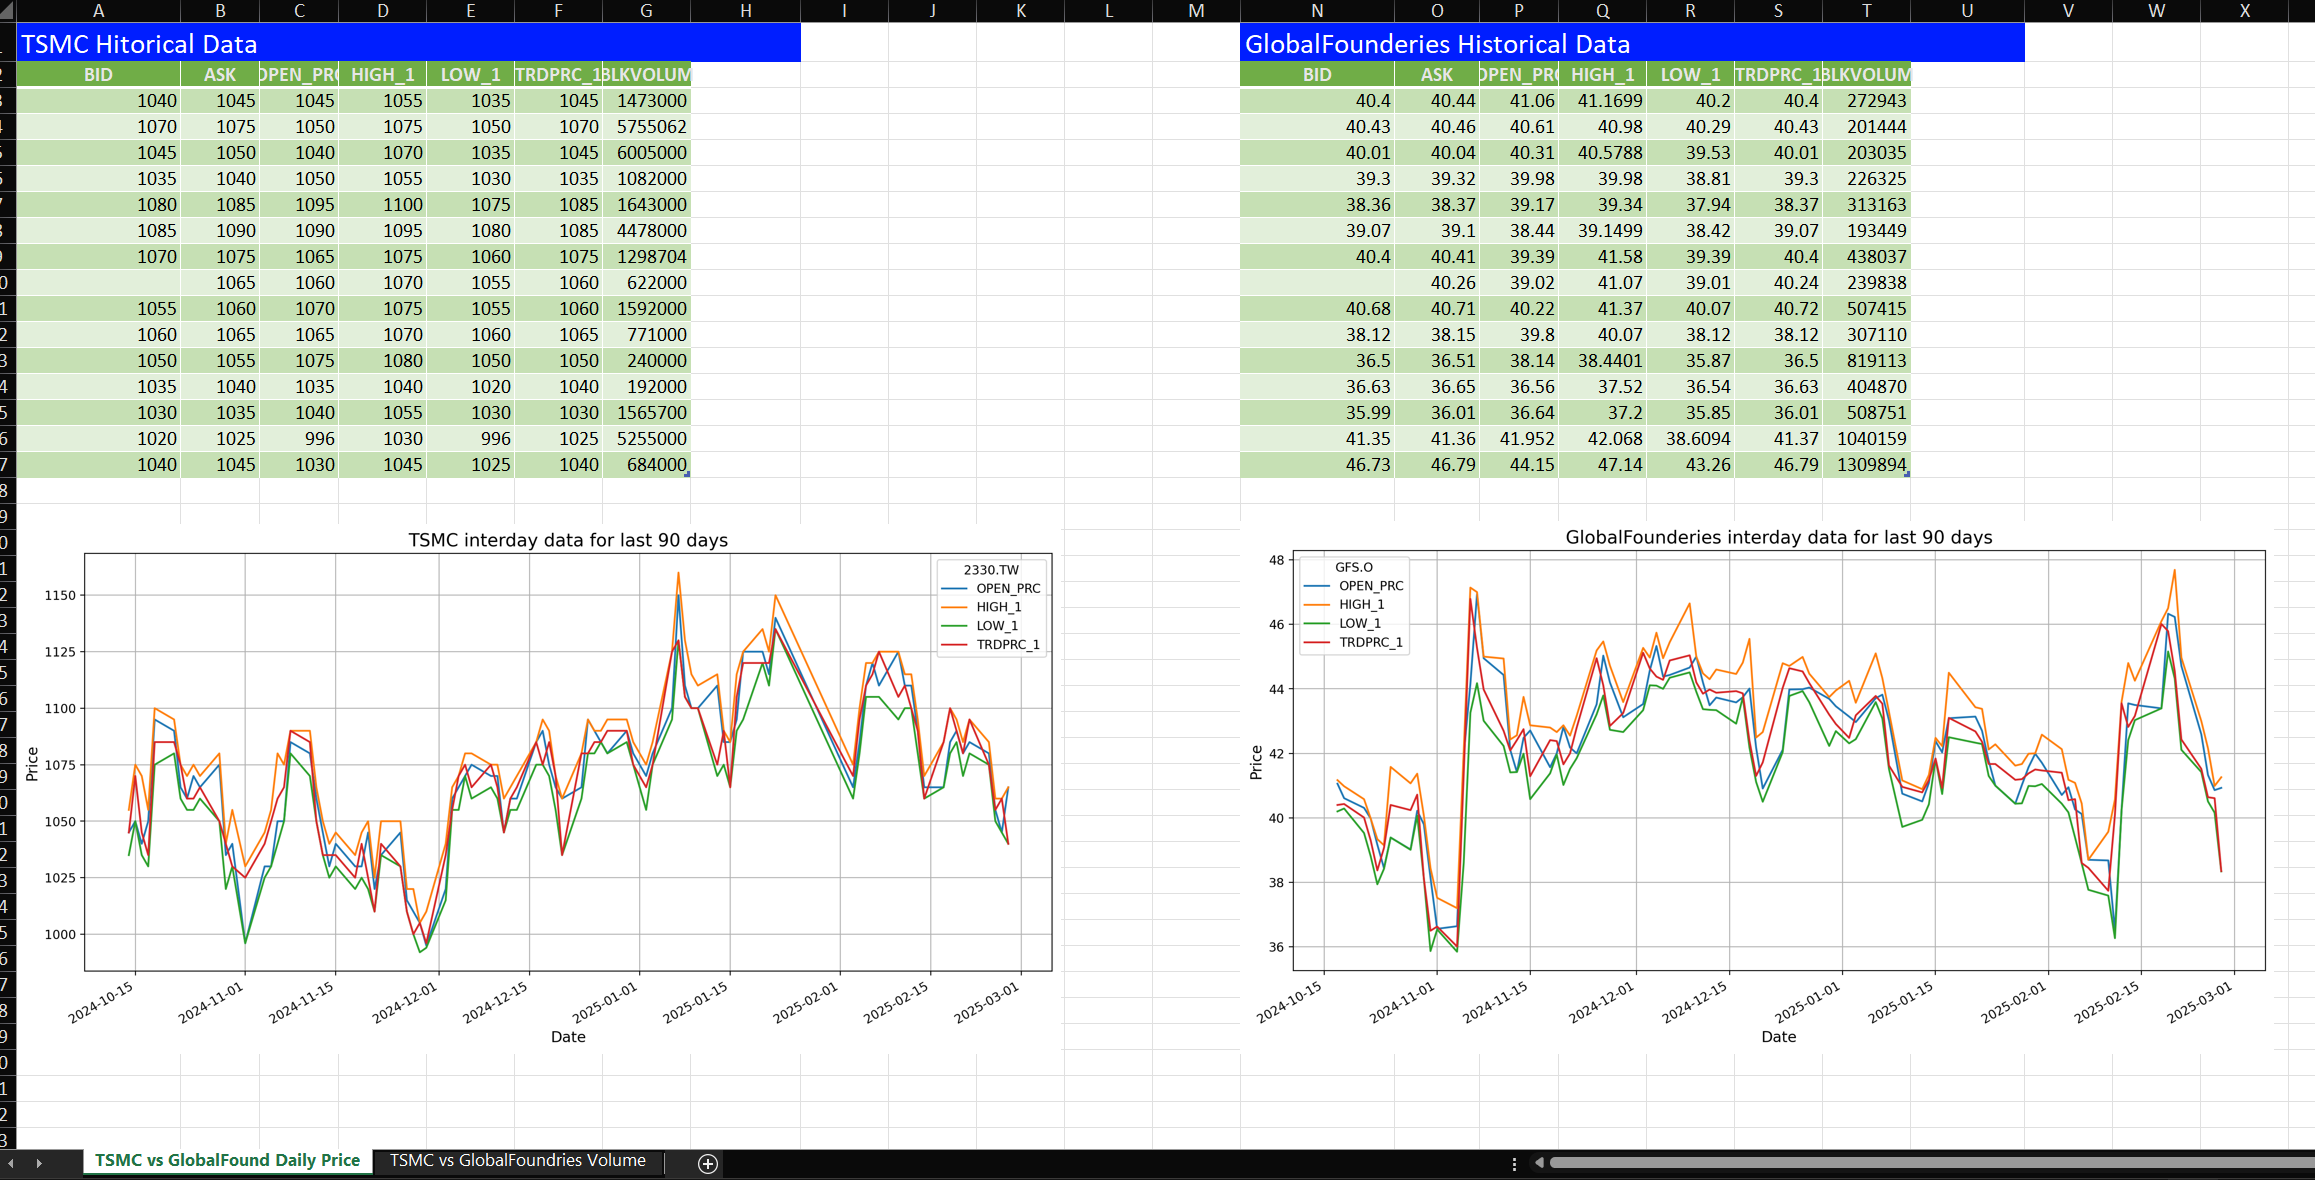
Firstly, I create the Excel template as part2_workspace_report_template.xlsx file. The report template contains two sheets, one for daily pricing comparison and one for volume comparison.
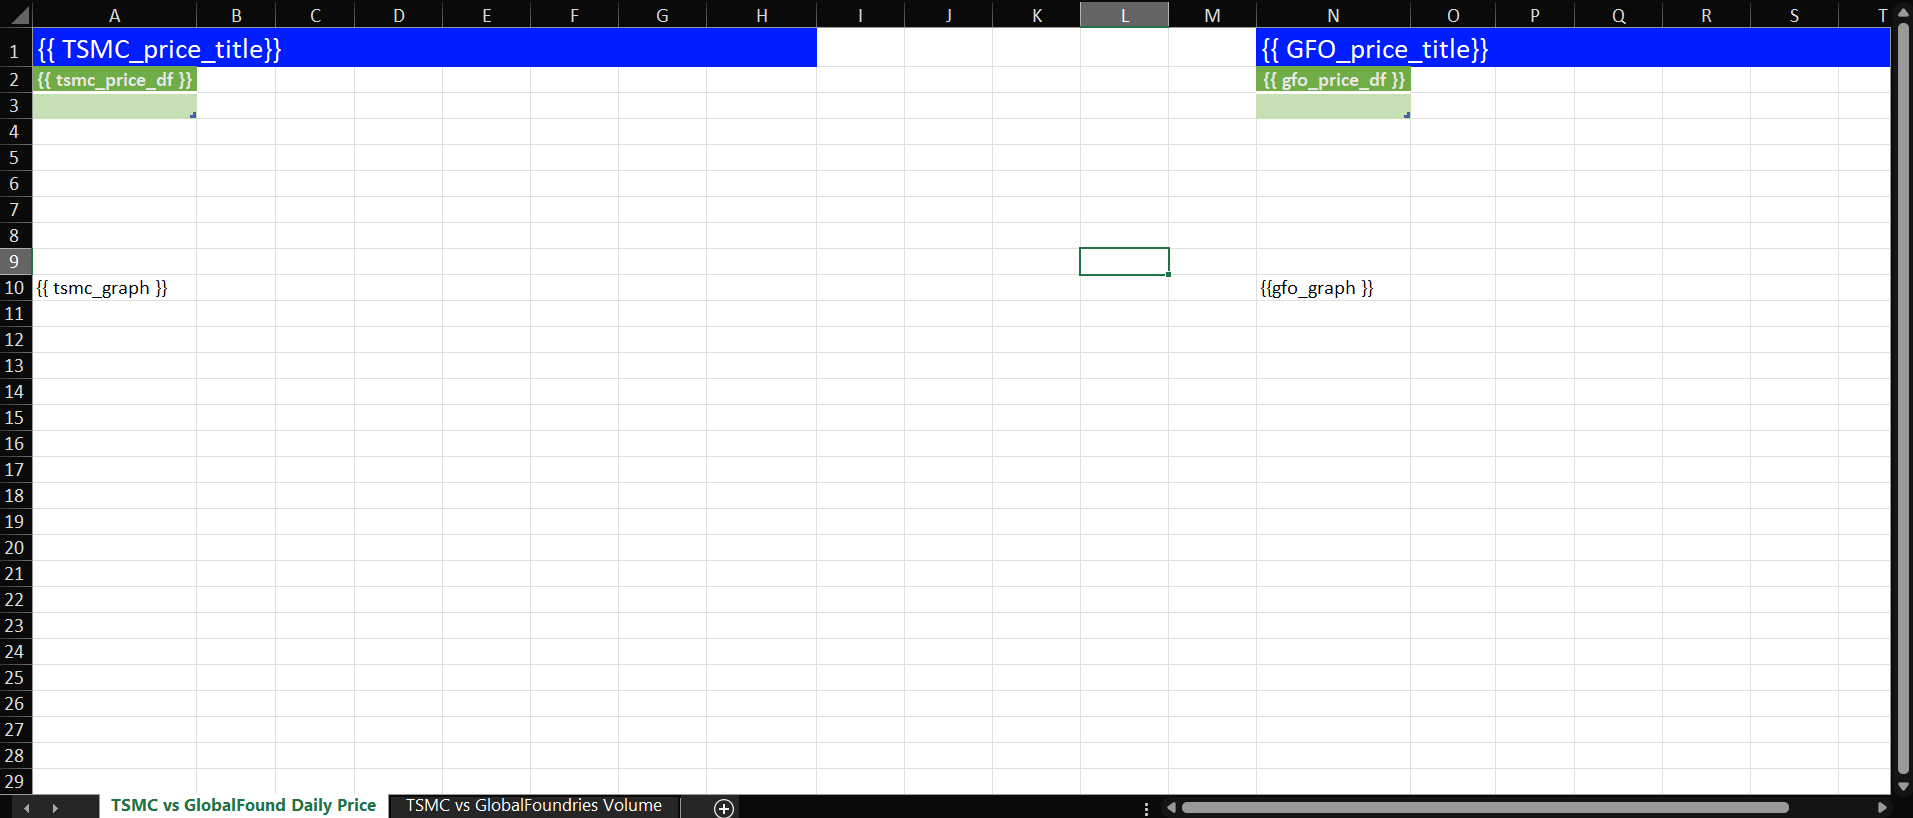
The daily pricing sheet template example is following:
Templates Variables
You will be noticed the double curly bracket placeholders like {{ tsmc_price_title}}, {{ tsmc_price_df}}, {{ gfo_graph }}, etc in the Excel template file. They are called templates variable. xlwings Reports will replace those template variables with data (Pandas DataFrame, text, Matplotlib/Plotly Charts, etc) from the Python code automatically.
Excel Table
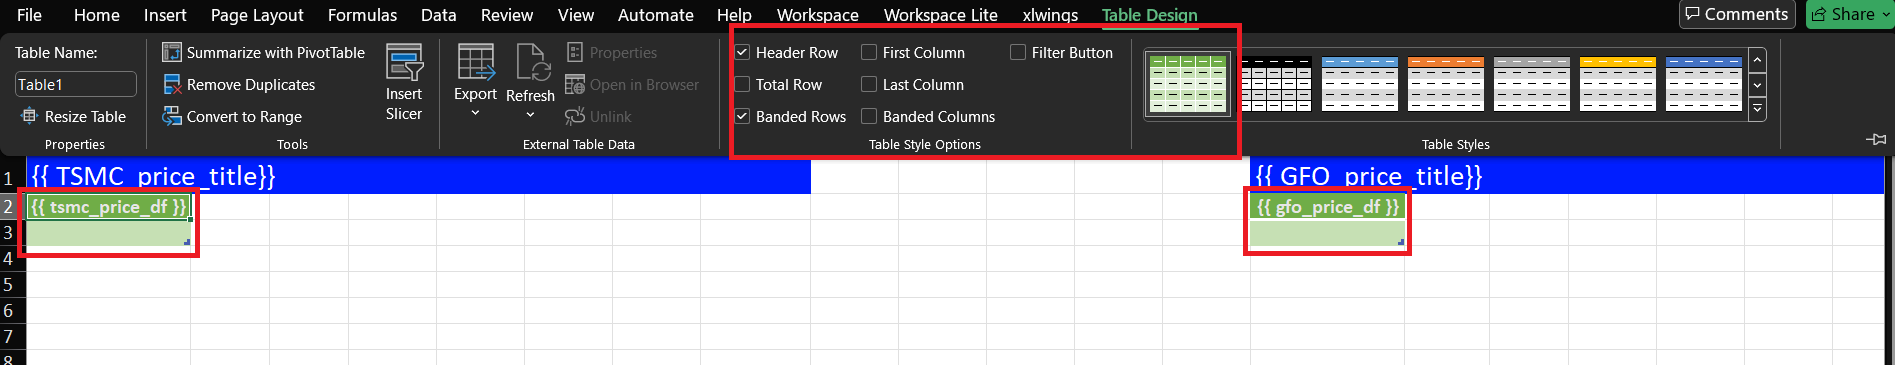
Let take a closer look in the Daily Price Sheet, the {{ tsmc_price_df}} and {{ gfo_price_df}} template variables are in the Excel Table.
Using Excel tables is the recommended way to format tables as the styling (themes and alternating colors) can be applied dynamically across columns and rows. You can create Excel Table by go to Insert > Table menus and make sure that you activate My table has headers before clicking on OK. Then add the placeholder as usual on the top-left in your template.
Note:
- For Excel table support, you need at least xlwings version 0.21.0.
- This feature supports Pandas DataFrame objects only (As of November 2020)
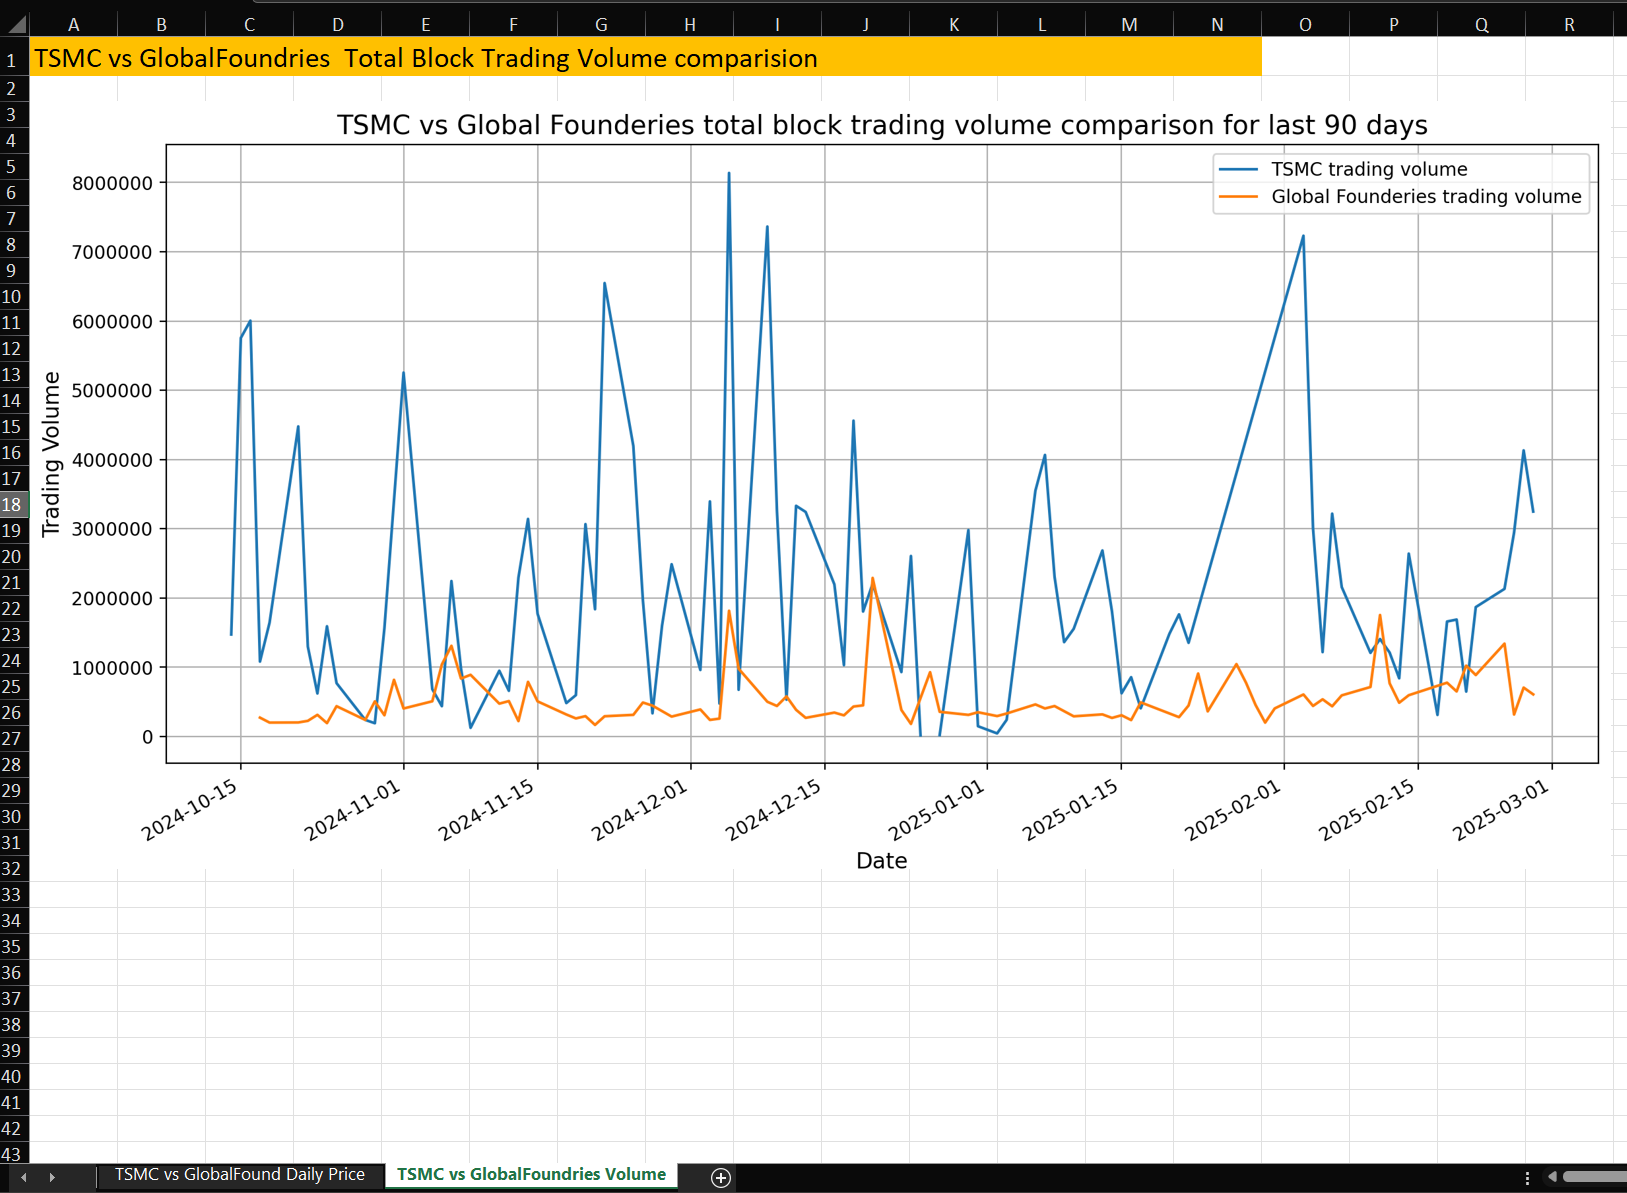
Multiple Sheets
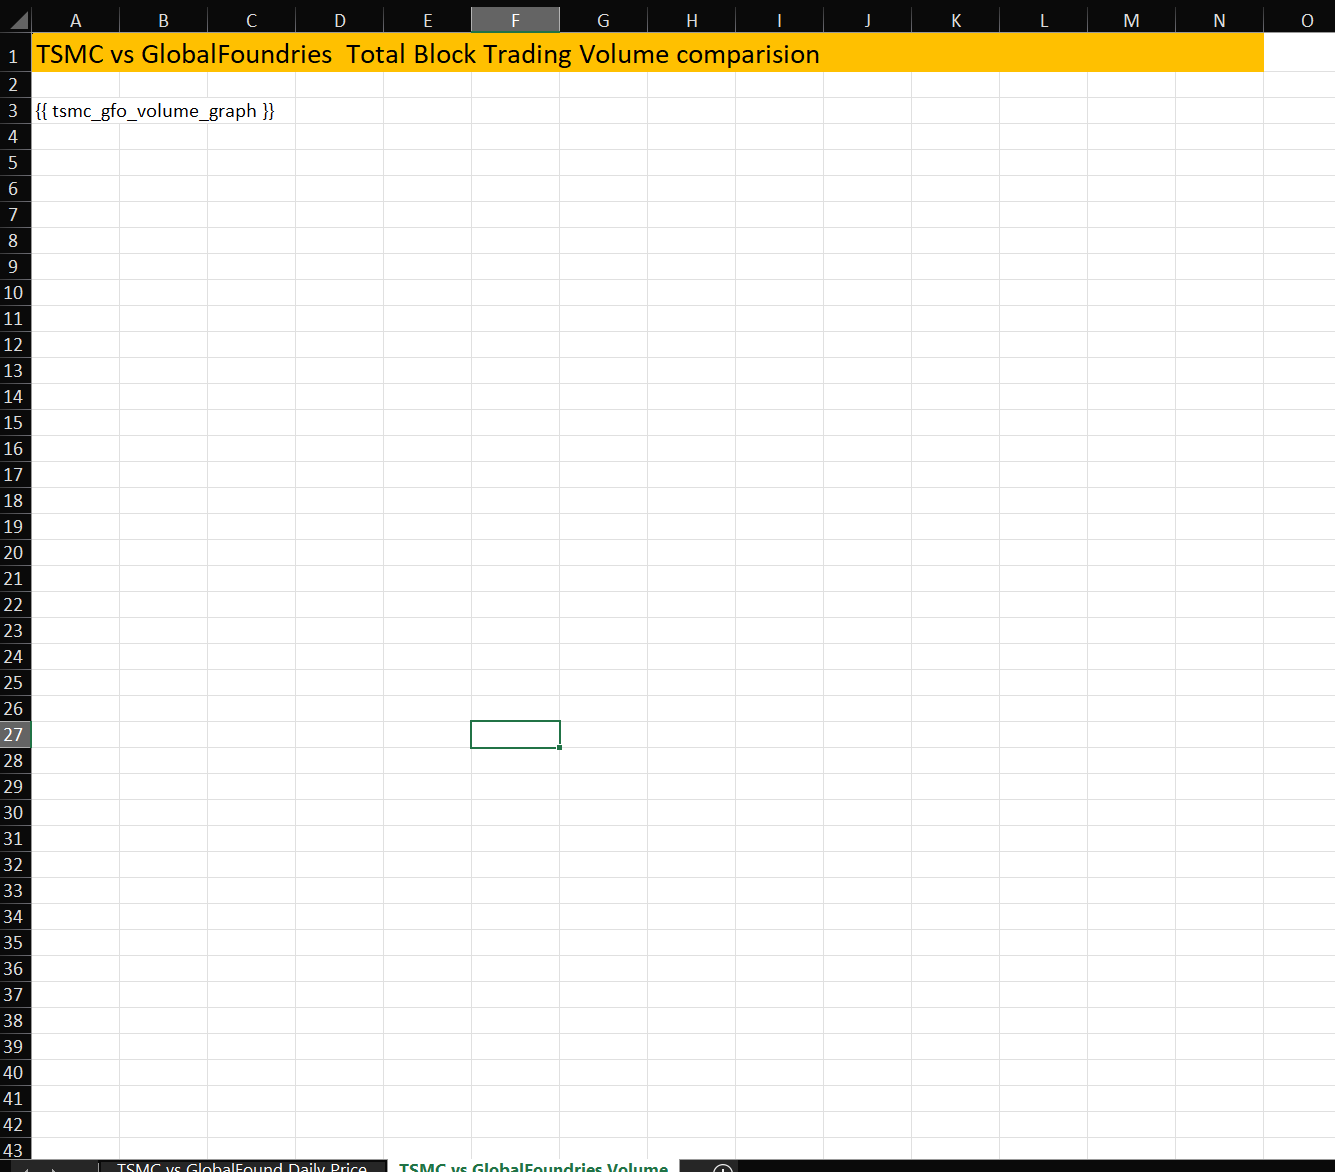
The xlwings Reports also support multiple Excel Sheets. Business users just create new Sheets in a single Excel template file and place template variables, frame tags in those Sheets based on the business requirements. xlwings PRO automatically replaces associate data in all Sheets. Developers do not need to manually create and manipulate new Excel Sheet(s) anymore.
Let's demonstrate with tsmc vs gfo Volume comparison Sheet template.
Shape Text
The xlwings Report supports template text in Shapes objects like Boxes or Rectangles with the templates variable. Please see more detail on the Shape Text feature page.
Note: This article does not demonstrate the Shape Text feature.
Now the template file is ready, we can continue on the data preparation side of the Python Code.
Code Walkthrough
TSMC vs GlobalFounderies Data Preparation: Days Daily Pricing data with the Data Library Content Layers
The Content layer refers to logical market data objects, representing financial items like level 1 market data prices and quotes, News, Historical Pricing, Bond Analytics, Environmental & Social Governance (ESG) and so on. These objects are built on top of the Delivery layer and provide value-add capabilities to manage and access the content within the interface.
When comparing to the Access Layer, the Content Layer provides much more flexible manners for developers:
- Richer / fuller response e.g. metadata, sentiment scores - where available
- Using Asynchronous or Event-Driven operating modes - in addition to Synchronous
- Streaming Level 1 Market Price Data - as well as Snapshot requests
- Developers can choose to get returns data in JSON structured messages or user-friendly Pandas DataFrame for Python based on their requirements.
The Content layer can easily be used by both professional developers and financial coders. It provides great flexibility for familiar and commonly used financial data models.
Please find more detail regarding the Content Layer on Data Library for Python document page.
Import xlwings PRO and Data Library
An application needs to import xlwings, xlwings.pro.reports, and lseg.data packages in order to interact with the xlwings Reports and Data library.
import xlwings as xw
from xlwings.pro.reports import create_report
import lseg.data as ld
from lseg.data.content import historical_pricing
from lseg.data.content.historical_pricing import Intervals
import matplotlib.pyplot as plt
import asyncio
Initiate and Getting Data from Data Library
Let me start by showing how to get TSMC and GlobalFounderies data from the Workspace with the Data Library. The Data Library lets the application consume data from the following platforms:
- DesktopSession (Workspace desktop application)
- PlatformSession (RDP, Real-Time Optimized)
- DeployedPlatformSession (deployed Real-Time/ADS)
This article only focuses on the DesktopSession. However, for other session types, the main logic is the same when it interacts with xlwings library.
# Open Desktop Session
ld.open_session(config_name='./lseg-data.config.json')
# Result: <lseg.data.session.Definition object at 0x12a42d33670 {name='workspace'}>
Next, we define all the necessary variables for requesting data from Desktop Session.
# Define RICs
tsmc_ric = '2330.TW'
gfo_ric = 'GFS.O'
fields = ['BID','ASK','OPEN_PRC','HIGH_1','LOW_1','TRDPRC_1','BLKVOLUM']
count = 90
This notebook example utilizes Python asyncio library to retrieve data from Content Layer's historical_pricing interface get_data_async() method asynchronously.
tasks = asyncio.gather(
historical_pricing.summaries.Definition(
universe = tsmc_ric,
fields = fields,
count = count,
interval = Intervals.DAILY).get_data_async(closure='TSMC'),
historical_pricing.summaries.Definition(
universe = gfo_ric,
fields = fields,
count = count,
interval = Intervals.DAILY).get_data_async(closure='GlobalFounderies')
)
Once the task (requests Daily data of TSMC and GlobalFounderies) is completed, get the response data in Pandas DataFrame object format via response_obj.data.df statement.
await tasks
def display_reponse(response):
print(response)
print("\nReponse received for", response.closure)
tsmc_interday, gfo_interday = tasks.result()
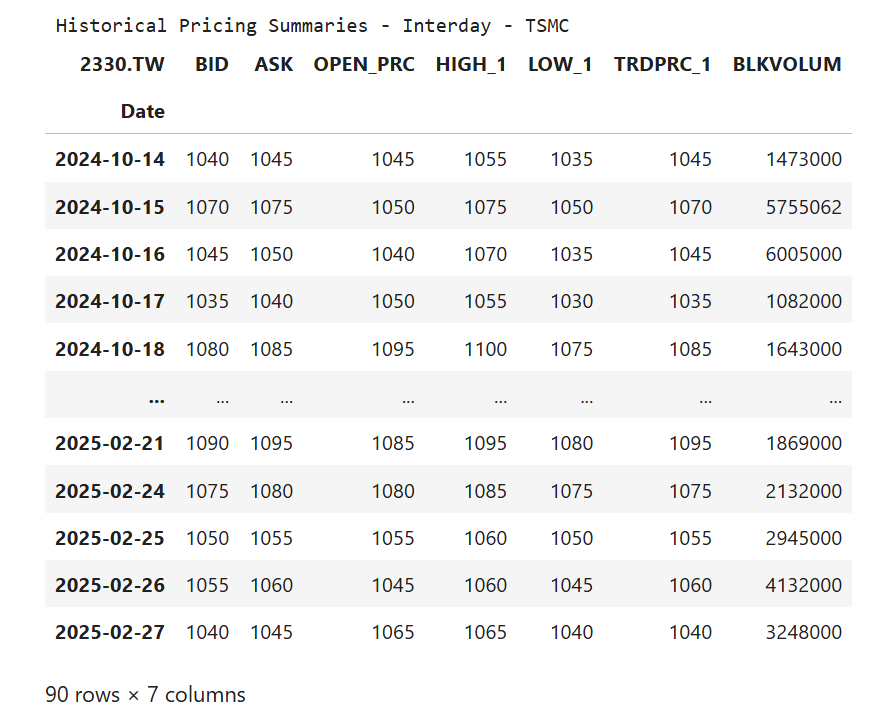
print("\nHistorical Pricing Summaries - Interday - TSMC")
tsmc_df_pricing = tsmc_interday.data.df
display(tsmc_df_pricing)
#check GFO data with the same code above
Now we have all raw TSMC and GlobalFounderies Daily Price data, we can close the Session.
# -- Close Session, just calls close_session() function
ld.close_session()
That covers how to get data with the Data Library.
Restructure DataFrame
Moving on to the data processing phase. The purpose of this phase is to make our raw data to read and to plot a graph easier.
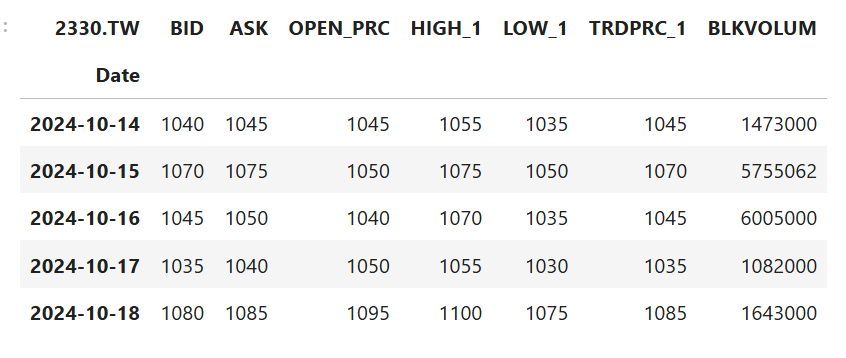
Please note that the restructure steps are identical to the part 1 notebook application. We start by naming the index column to "Date"
tsmc_df_pricing.index.name = 'Date'
gfo_df_pricing.index.name = 'Date'
tsmc_df_pricing.head(5)
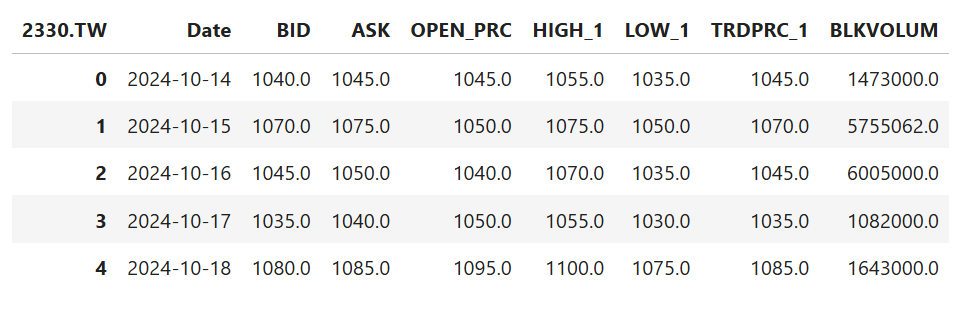
Next, we change all non-Date columns data type from String to Float, and change the DataFrame Date index to be a data column. This will let us plot a graph using Date as X-Axis.
for column in tsmc_df_pricing:
tsmc_df_pricing[column]=tsmc_df_pricing[column].astype(float)
for column in gfo_df_pricing:
gfo_df_pricing[column]=gfo_df_pricing[column].astype(float)
tsmc_df_pricing.reset_index(level=0, inplace=True)
gfo_df_pricing.reset_index(level=0, inplace=True)
tsmc_df_pricing.head(5)
Finally, we sort data in ascending order.
# Sort DataFrame by Date
tsmc_df_pricing.sort_values('Date',ascending=True,inplace=True)
gfo_df_pricing.sort_values('Date',ascending=True,inplace=True)
Let's leave the data processing phase there.
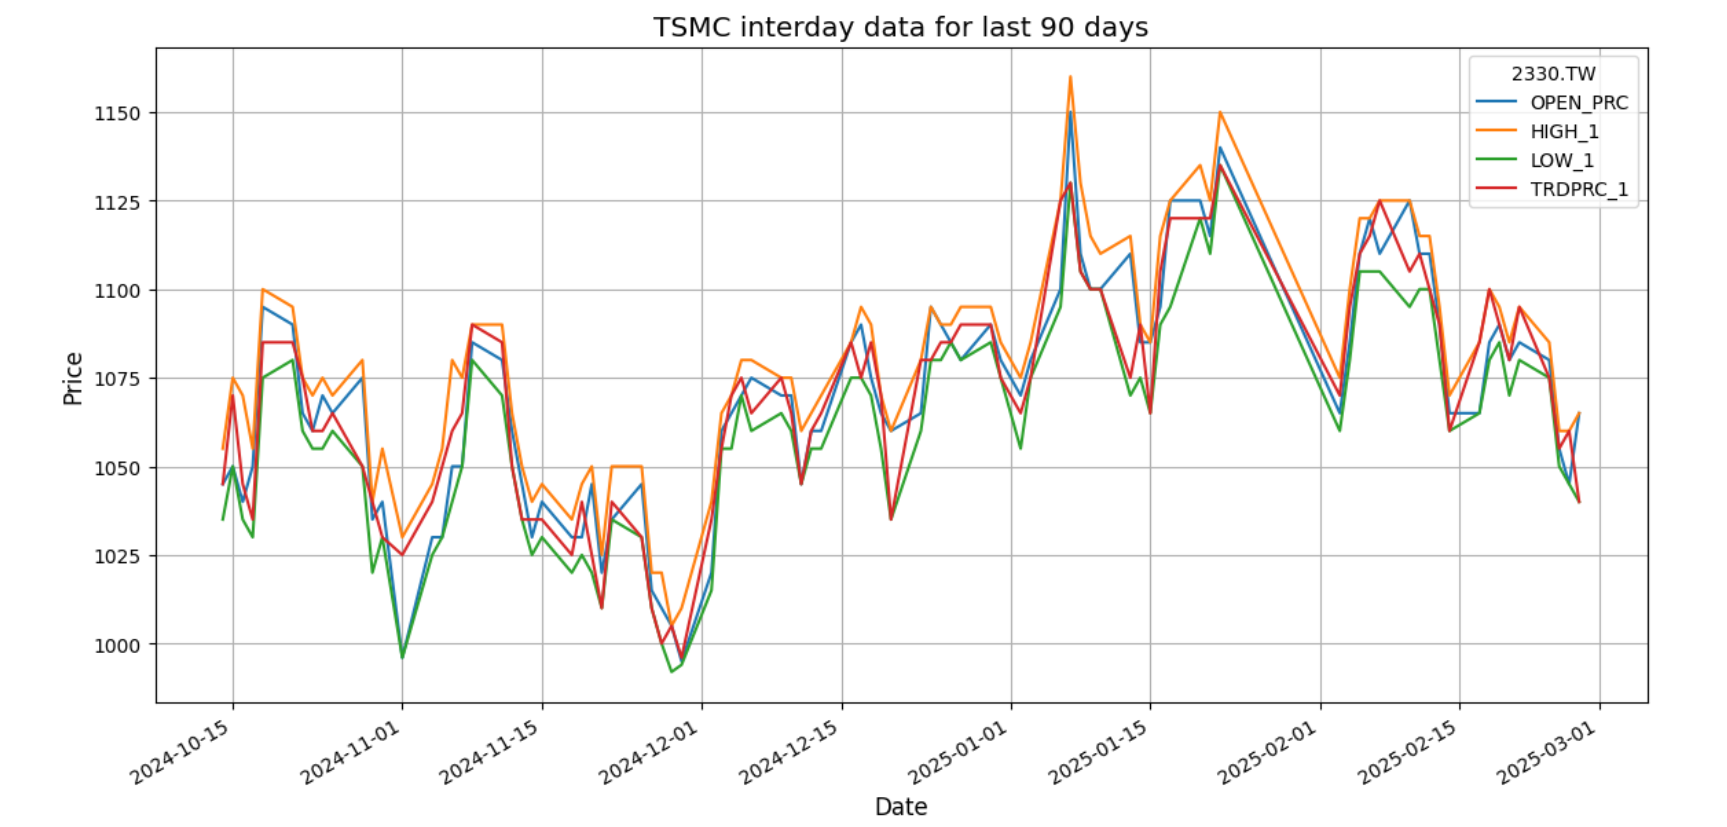
Plotting TSMC and GlobalFounderies 90 Daily Pricing Charts
My next point is how to plot graphs with our historical pricing data. We use Matplotlib's Pyplot library to plot Intel and AMD Daily Pricing graphs. Each graph represents interday data for the last 90 days pricing information.
The source code also creates the Pyplot Figure objects which we will pass them to the report file as pictures.
# Plotting a Graph for TSMC
columns = ['OPEN_PRC','HIGH_1','LOW_1','TRDPRC_1']
tsmc_df_pricing.set_index('Date',drop=True,inplace=True)
tsmc_figure = plt.figure()
plt.xlabel('Date', fontsize='large')
plt.ylabel('Price', fontsize='large')
# Create graph title from Company and RIC names dynamically.
plt.ticklabel_format(style = 'plain')
plt.title('TSMC interday data for last 90 days', color='black',fontsize='x-large')
ax = tsmc_figure.gca()
tsmc_df_pricing.plot(kind='line', ax = tsmc_figure.gca(),y=columns,figsize=(14,7) , grid = True)
plt.show()
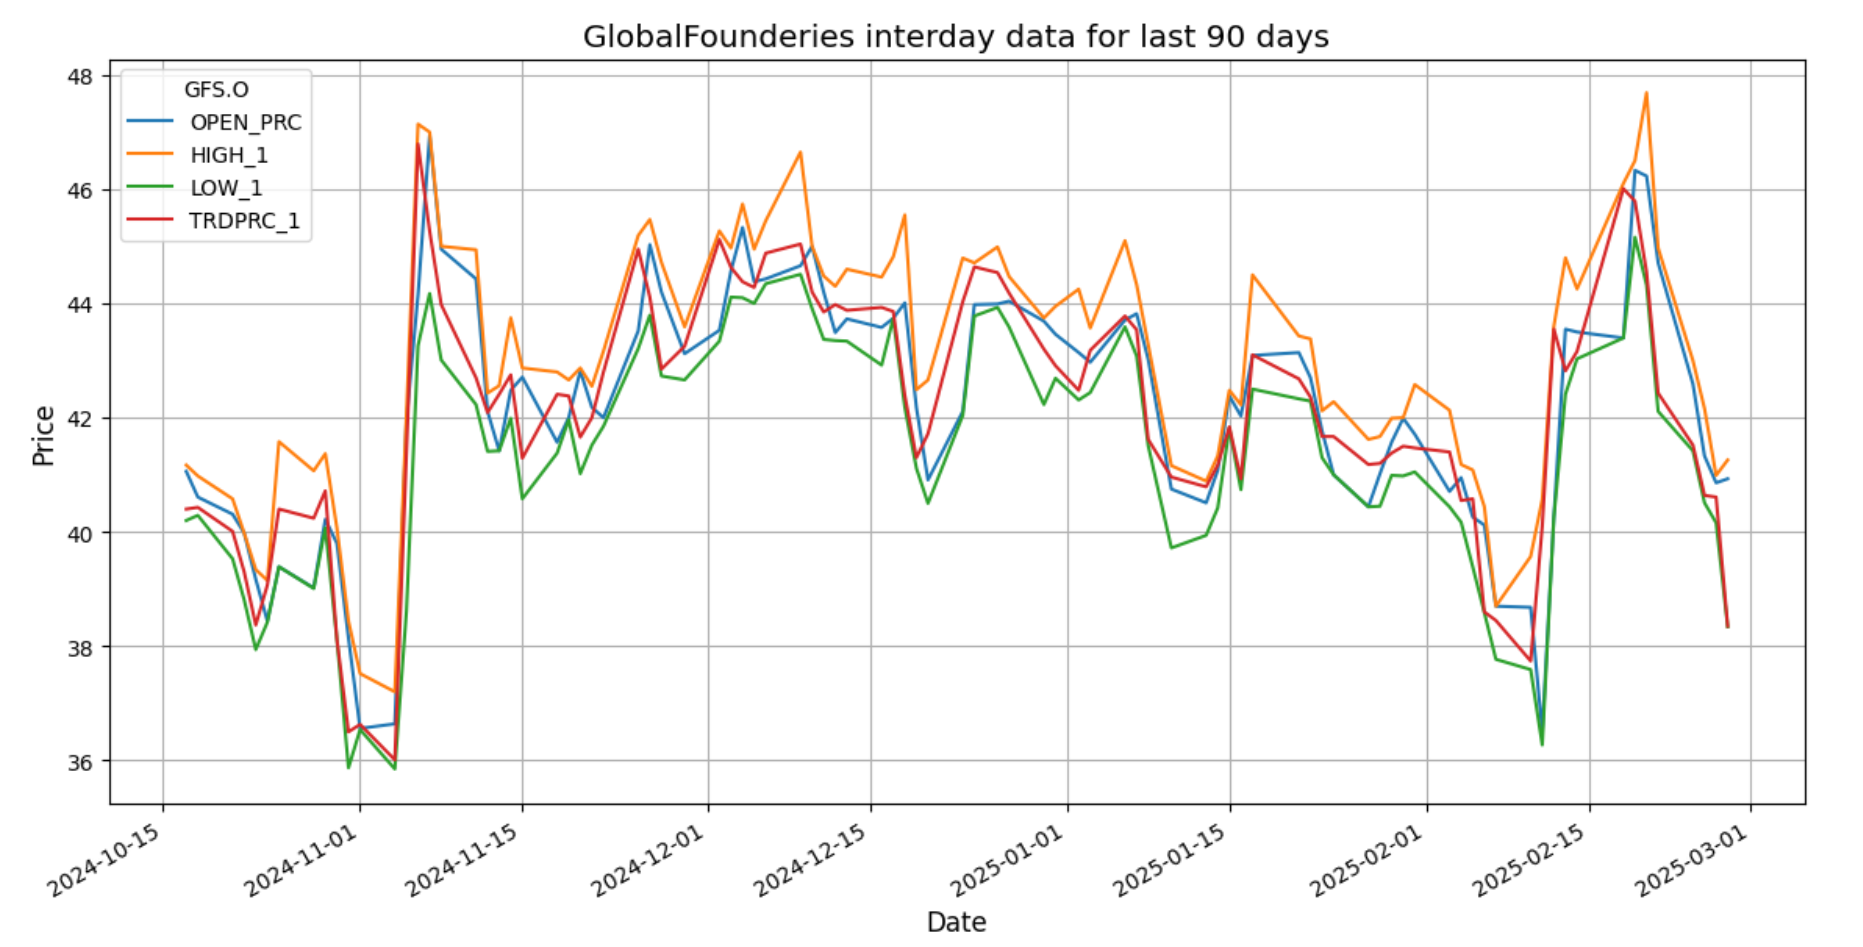
# Plotting a Graph for GlobalFounderies
columns = ['OPEN_PRC','HIGH_1','LOW_1','TRDPRC_1']
gfo_df_pricing.set_index('Date',drop=True,inplace=True)
gfo_figure = plt.figure()
plt.xlabel('Date', fontsize='large')
plt.ylabel('Price', fontsize='large')
# Create graph title from Company and RIC names dynamically.
plt.ticklabel_format(style = 'plain')
plt.title('GlobalFounderies interday data for last 90 days', color='black',fontsize='x-large')
ax = gfo_figure.gca()
gfo_df_pricing.plot(kind='line', ax = gfo_figure.gca(),y=columns,figsize=(14,7), grid = True )
plt.show()
Now we got the charts and figure objects ready for the Pricing Sheet report. Next, we will create the Volume comparison chart for the Intel vs AMD Volume comparison Sheet.
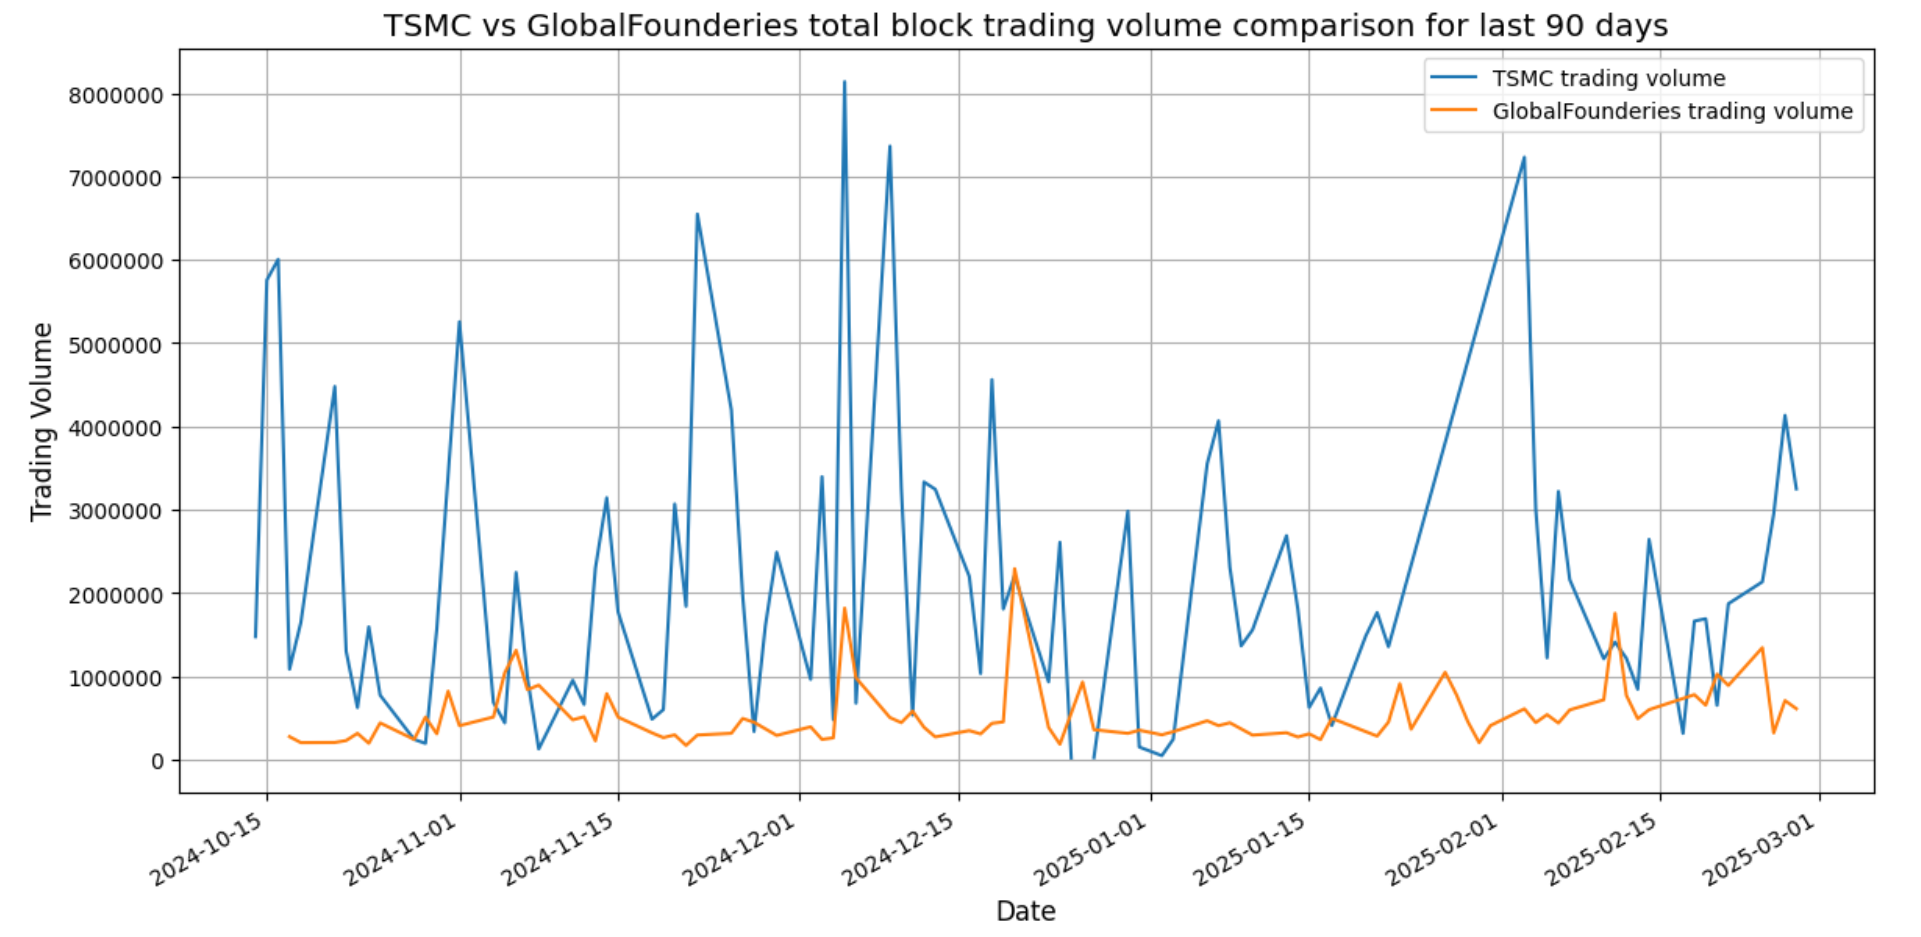
Plotting TSMC vs GlobalFounderies Volume Comparison Chart
The next chart is block trading volume comparison which is the BLKVOLUM data field. This chart contains Intel and AMD data in the same figure.
columns = ['BLKVOLUM']
# TSMC
tsmc_gfo_volume_figure = plt.figure()
plt.xlabel('Date', fontsize='large')
plt.ylabel('Trading Volume', fontsize='large')
# Create graph title from Company and RIC names dynamically.
plt.ticklabel_format(style = 'plain')
plt.title('TSMC vs GlobalFounderies total block trading volume comparison for last 90 days', color='black',fontsize='x-large')
ax = tsmc_gfo_volume_figure.gca()
tsmc_df_pricing.plot(kind='line', ax = tsmc_gfo_volume_figure.gca(),y=columns,figsize=(14,7) , label=['TSMC trading volume'],grid = True)
# GFO
gfo_df_pricing.plot(kind='line', ax = ax ,y=columns,figsize=(14,7), label=['GlobalFounderies trading volume'],grid = True)
plt.show()
That’s all I have to say about how to plot graph for TSMC and GlobalFounderies data.
Generate Report with xlwings PRO
Now all data (DataFrame and Charts) is ready. That brings us to export all data we have in Python and Jupyter Notebook to Excel. I have demonstrated the Reports-API and with Reports API render_template() function in the part-1 article as the following example.
app = xw.App(visible=True)
report = app.render_template(
'report_template.xlsx',
'report_pro.xlsx',
historical_title=historical_title,
df_historical=df_historical.head(10),
graph = fig)
The code above is ok for small data. This part-2 notebook will show more features that developers can work with the render_template() method for supporting various requirements and template variables.
Firstly, let's define static texts and template/report file location.
# Define Static texts and template/report file location.
tsmc_price_title='TSMC Hitorical Data'
gfo_price_title = 'GlobalFounderies Historical Data'
template_file = 'part2_workspace_report_template.xlsx'
report_file = 'part2_ws_tsmc_vs_gfo.xlsx'
Next, I create a Python Dictionary object to collect all data for template variables. Please note that the Dictionary keys must have the same names as template variables.
# Create a Dictionary to collect all report data
data = dict(
TSMC_price_title=tsmc_price_title,
tsmc_price_df = tsmc_df_pricing.head(15),
tsmc_graph = tsmc_figure,
GFO_price_title = gfo_price_title,
gfo_price_df = gfo_df_pricing.head(15),
gfo_graph = gfo_figure,
tsmc_gfo_volume_graph = tsmc_gfo_volume_figure
)
Then we call the create_report function.
app = xw.App(visible=True)
report = app.render_template(
template_file,
report_file,
**data)
The render_template() mehtod above generates the part2_ws_tsmc_vs_gfo.xlsx Excel report file with format/style defined in part2_rdp_report_template.xlsx file and data that we pass to the function. With the default parameter, the part2_ws_tsmc_vs_gfo.xlsx file will be open automatically.
Developers can control the Excel instance with the xlwings App instance. For example, to run the report in a separate and hidden instance of Excel. This is a useful feature if developers aim to create an application that runs as a background service to generate reports daily, monthly, or weekly based on the business requirements.
with xw.App(visible=False) as app:
report = app.render_template(
template_file,
'part_2_daily_report.xlsx,
**data)
Now the part_2_daily_report.xlsx Excel report file is created in the background.
Exporting Excel report to PDF
With newly release xlwings version 0.21.1 onward, the xlwings CE can export the whole Excel workbook or a subset of the sheets to a PDF file with xlwings Book.to_pdf() method. Please see more detail regarding the to_pdf method on xlwings API reference page.
I am demonstrating this feature with a quick Python source code from the part-1 article to create the TSMC Daily Pricing report in PDF file format.
Firstly, create a new blank Excel report file and set a basic Report style.
wb = xw.Book() # Creating an new excel file. wb = xw.Book(filename) would open an existing file
tsmc_price_sheet = wb.sheets[0]
tsmc_price_sheet.name = 'TSMC Pricing'
tsmc_price_sheet.range("A1").value = 'TSMC Pricing'
tsmc_price_sheet.range("A1").api.Font.Size = 14 # Change font size
tsmc_price_sheet.range("A1").api.Font.ColorIndex = 2 # Change font color
tsmc_price_sheet.range('A1:H1').color = (0,0,255) # Change cell background color
# Set Pandas DataFrame object to newly created Excel File
tsmc_price_sheet.range("A2").value = tsmc_df_pricing.head(15)
# Set data table format
tsmc_price_sheet.range('2:1').api.Font.Bold = True #Make Column headers bold
tsmc_price_sheet.range('A2:H2').color = (144,238,144) # Change cell background color
tsmc_price_sheet.autofit('c') # Set sheet autofit the width of column
Next, find the position of the last row of the report table as a position to plot a graph (tsmc_figure).
# historical_sheet.cells.last_cell.row = row of the lower right cell
'''
change to your specified column, then go up until you hit a non-empty cell
'''
tsmc_price_last_row = tsmc_price_sheet.range((tsmc_price_sheet.cells.last_cell.row, 1)).end('up').row
rng = tsmc_price_sheet.range('A{row}'.format(row = tsmc_price_last_row + 1))
# Resize inte_figure Figure object
tsmc_figure.set_figheight(6)
tsmc_figure.set_figwidth(6)
# Add figure to Excel report file as a picture
tsmc_price_sheet.pictures.add(tsmc_figure, name='MyPlot', update=True, top=rng.top, left=rng.left)
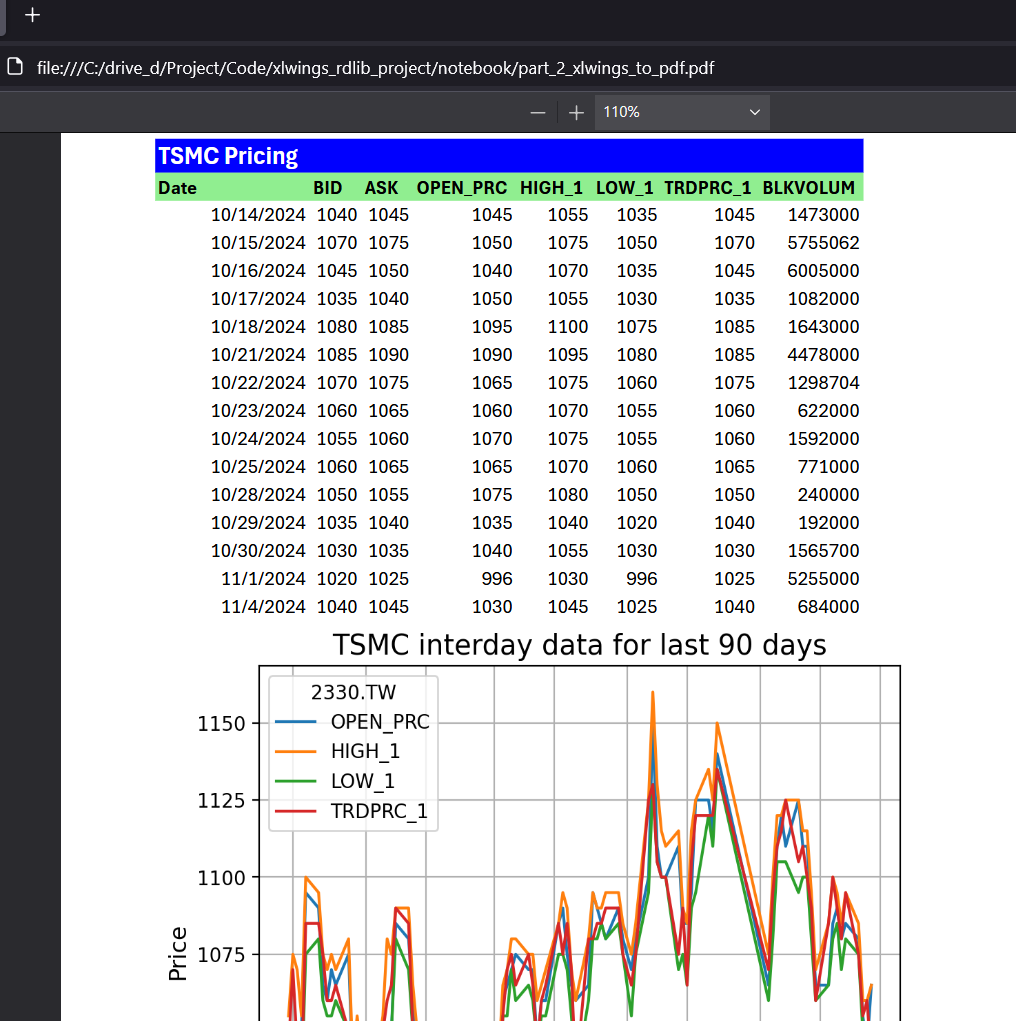
Then call the Book.to_pdf() method to save this Excel report file as a PDF file.
# defaults to the same name as the workbook, in the same directory
wb.to_pdf('./part_2_xlwings_to_pdf.pdf')
The Excel report with TSMC content will be saved as part_2_xlwings_to_pdf.pdf file.
That covers Excel Report with xlwings PRO.
Conclusion and Next Step
That brings me to the end of my article. The xlwings CE library lets Python developers integrate data with Excel in a simple way. The xlwings PRO allows Python developers and business users to work together to integrate data with Excel or PDF report file in much easier than xlwings CE.
The xlwings Reports help businesses and financial teams design the report to match their business requirement freely. The Python developers/data engineers can focus on how to retrieve and optimize data without no need to worry about report design, look & feel. xlwings Reports also help developers can automate report generator process periodicity (such as a daily, weekly, or monthly report).
If users want dynamic data and charts in the report file, the xlwings Embedded Code feature lets users run Python code in the macro-enabled Excel report directly. Users do not need to run a separate Python code themselves or wait for Developers to generate a report file for them.
The newly introduced to_pdf feature also lets developers export the Excel Workbook/Sheets to the PDF file. This function helps business users who do not have Microsoft Office installed can still be able to open the PDF report file.
At the same time, the Data Library for Python let developers rapidly access the Data Platform content with a few lines of code that easy to understand and maintain. Developers can focus on implement the business logic or analysis data without worry about the connection, authentication detail with the Platforms.
The integration between LSEG APIs and xlwings is not limited to only the Data Library. Any LSEG APIs that support Python programming language such as Data/Delivery Platform APIs, or LSEG Tick History - REST API, or DataStream Web Service - Python can work with the xlwings library using the same concept and code logic as this Data Library notebook examples.
That covers all I wanted to say today.
References
You can find more details regarding the Data Library for Python, xlwings and, related technologies for this notebook from the following resources:
- LSEG Data Library for Python on the LSEG Developer Community website.
- Xlwings website.
- Xlwings CE Document page.
- xlwings Pro page.
- xlwings API Reference page.
- xlwings Reports page.
- xlwings Embedded Code page.
- Integrating LSEG Financial Data to Excel with Xlwings and Data Library - Part 1
For any questions related to this article or Data Library, please use the Developers Community Q&A Forum.