


Introduction
In the fast-paced world of finance, staying ahead means keeping informed of the latest news and market sentiments. With the vast amounts of data available, manual analysis is no longer viable. Here, we explore a breakthrough approach using Natural Language Processing (NLP). One of the critical applications of NLP is Sentiment analysis, which helps in understanding the emotional tone behind a body of text. In this article, we are going to explore how to leverage the Large Language Models (LLMs) for analyzing sentiments in financial news headlines, offering a glimpse into future investment strategies.
What is Natural Language Processing (NLP)?
NLP, or Natural Language Processing, is a field of artificial intelligence (AI) that focuses on the interaction between computers and humans through natural language. It involves various tasks and techniques to enable computers to understand, intepret, and generate human languague. Some of the key tasks in NLP used in this article include
- Tokenization: Splitting text into smaller units like words or sentences.
- Part-of-Speech tagging: Identifying the grammatical parts of speech in a sentence.
- Named Entity Recognition (NER): Detecting and classifying entities like names, dates, and organizations in text.
- Sentiment Analysis: Determining the sentiment or emotion expressed in a piece of text.
Understanding LLMs and Their Role in Finance
LLMs, or Large Language Models, are subset of NLP models that are trained on vase amounts of text data to perform various language tasks. It is advanced AI tools capable of understanding and generating human-like text. By training on extensive datasets, they can interpret variation in language, making them perfect for analyzing the sentiment of financial news headlines. This method provides a more variation understanding of market sentiments, going beyond traditional analysis methods.
The Study: A Brief Overview
Our reference study showcases LLMs' ability to categorize news headlines into positive, negative, or neutral sentiments towards stock prices. This categorization was then linked to stock market returns, revealing that LLMs could predict stock movements more accurately than previous models. This insight opens new avenues for investors to gauge market sentiment and make informed decisions.
Pre-requisites:
- LSEG Workspace application with access to The Data Library desktop session, or Data Platform session
- App Key (as the Desktop session is used here)
- Python 3.9 or above
- Required Python libraries
refinitiv.data==1.5.1
transformers==4.41.1
numpy==1.23.4
pandas==2.0.2
plotly==5.19.0
tqdm==4.66.1
Practical Application: Analyzing Sentiments with Python
Actually, we provide Machine Readable News products with News Analytics (such as sentiment) over our Real-Time platform in realtime at very low latency - these products are essentially consumed by algorithmic applications as opposed to humans. Here we are trying to do a similar thing as simply as possible to illustrate the key elements without having to do this in a low latency environment but do this with the Data Library for Python instead.
For of the LSEG's Data Library, integrating LLMs into your investment strategy can be straightforward. Python, a versatile programming language, serves as the bridge with 'transformers' Python library by Hugging Face to perform sentiment analysis on news headlines using LLMs.
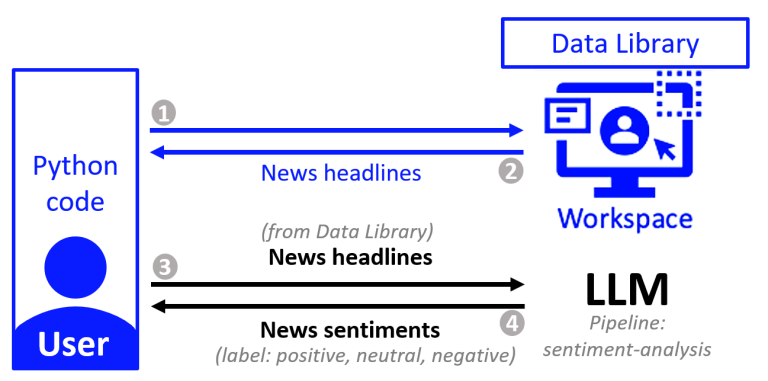
Here’s a simplified step-by-step guide. First, let's load the packages needed and open the Data Library's session to retrieve the data
import refinitiv.data as rd
from transformers import BertTokenizer, BertForSequenceClassification
from transformers import pipeline
from datetime import datetime, timedelta
import time
import numpy as np
import pandas as pd
pd.set_option('display.max_colwidth', None)
import plotly.express as px
import tqdm
tqdm.tqdm.pandas()
1. Fetching Data:
Use LSEG's Data Library to retrieve the latest financial news headlines relevant to your interests.
First, create and define constants to be used
- ric: The Refinitiv Identification Code is a market-level identifier for instruments and pricing sources. To find the RIC you're looking for, you can use
- d_now: Today's date
- max_end_date: 300 days ago, the date we want to retrieve the news since
ric = 'PTT.BK' # Refinitiv Identification Code
d_now = datetime.now().date()
max_end_date = d_now - timedelta(days=300) # upto months=15
print(f'start date is: {max_end_date}\nend date is: {d_now} (today)')
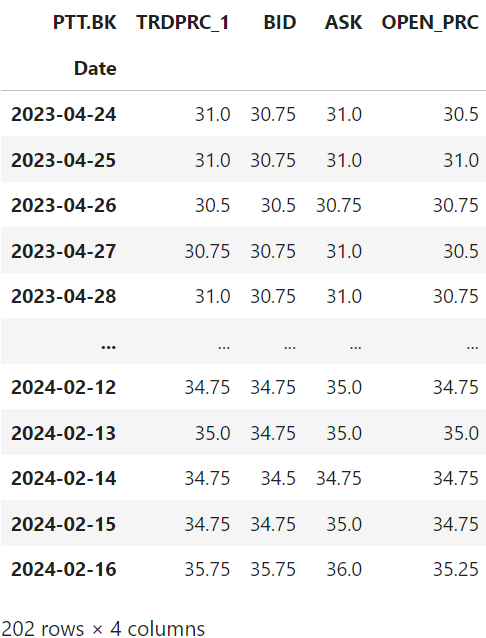
Then get the historical pricing to be used in visualization of the relation between news sentiment and pricing.
Example: EX-1.01.02-GetHistory.ipynb
# Get historical pricing
price_df = rd.get_history('PTT.BK', ['TRDPRC_1', 'BID', 'ASK', 'OPEN_PRC'], start = max_end_date, end = d_now)
price_df
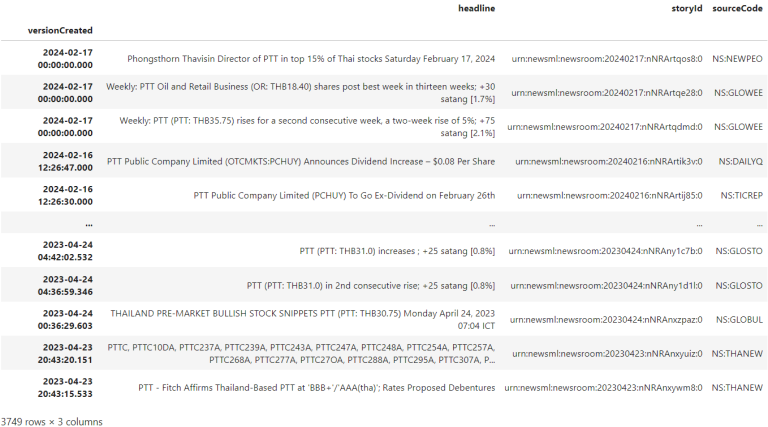
Retrieve news headlines data
Example: EX-1.01.05-News.ipynb
# Get news headlines
news_headlines_df = rd.news.get_headlines("R:" + ric , start= str(d_now), end = str(max_end_date), count=5000)
news_headlines_df
Then as we finished retrieving the data, close the data library session with rd.close_session()
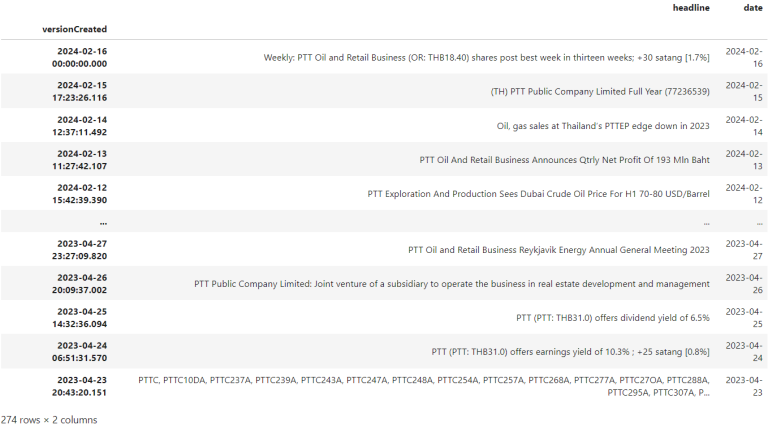
2. Data Preparation
We're going to select only first news each day for a demonstration purpose, so it's easier to see the relations between news and price of instrument. Then export these dataframes as CSV file.
# Create date column
news_headlines_df.drop(columns=['storyId', 'sourceCode'], inplace = True)
news_headlines_df.loc[:, 'date'] = pd.to_datetime(news_headlines_df.index, format = '%Y/%m/%d').date
# Export as CSV files
price_df.to_csv('dataset/historical_pricing.csv')
news_headlines_df.to_csv('dataset/news_headline.csv')
# Select only first news each day
news_headlines_df.drop_duplicates(subset=['date'], inplace=True)
news_headlines_df
3. Sentiment Analysis:
Leverage an LLM to analyze these headlines, classifying them based on their sentiment. We're using models from Hugging-face here, the detail and list of models available can be found in this page. You can try playing around by searching and picking the model you're interested in. However, the model to be used must not store the data we send them based on the license of the Data Library usage.
We use FinancialBERT for Sentiment Analysis, it is a BERT model pre-trained on a large corpora of financial texts. The purpose is to enhance financial NLP research and practice in financial domain, hoping that financial practitioners and researchers can benefit from this model without the necessity of the significant computational resources required to train the model.
The model was fine-tuned for Sentiment Analysis task on Financial PhraseBank dataset. Experiments show that this model outperforms the general BERT and other financial domain-specific models.
More details on FinancialBERT's pre-training process can be found here.
The model can be used thanks to Transformers pipeline for sentiment analysis as below
pretrained_model = 'ahmedrachid/FinancialBERT-Sentiment-Analysis'
model = BertForSequenceClassification.from_pretrained(pretrained_model,num_labels=3)
tokenizer = BertTokenizer.from_pretrained(pretrained_model)
nlp = pipeline("sentiment-analysis", model=model, tokenizer=tokenizer)
def sentiment_analysis(sentences):
return nlp(sentences)[0]['label']
start_time = time.time()
news_headlines_df['Good news'] = news_headlines_df['headline'].apply(sentiment_analysis)
end_time = time.time()
execution_time = end_time - start_time
print("Execution time:",execution_time)
Pass news headline parameters into the function created above and store the responses into columns Good news (is this headline considered a good news). And as the available value of label returned are: positive, neutral, negative, we're going to map them with YES (positive - as it's a good news), NO (negative), UNKNOWN (neutral)
news_headlines_df['Good news'] = news_headlines_df['Good news'].map({'neutral': 'UNKNOWN', 'negative': 'NO', 'positive': 'YES'})
Here's the example result
4. Visualization:
To see the relation between news sentiments and prices. Now you could use the sentiment analysis to inform your investment strategies, focusing on how news sentiments could affect stock prices.
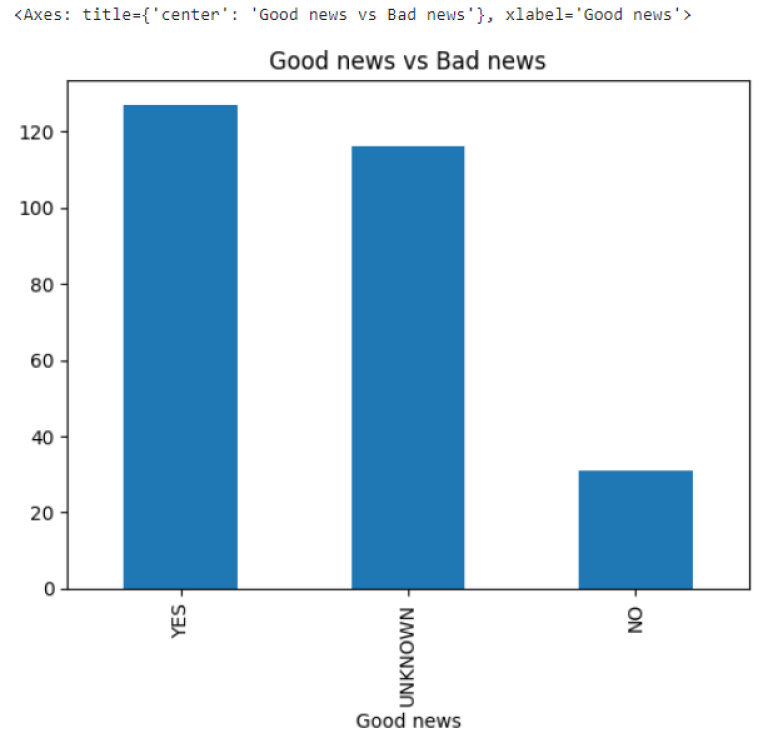
Plot the ratio of Good news, Bad news, Unknown
news_headlines_df['Good news'].value_counts().plot.bar(title='Good news vs Bad news')
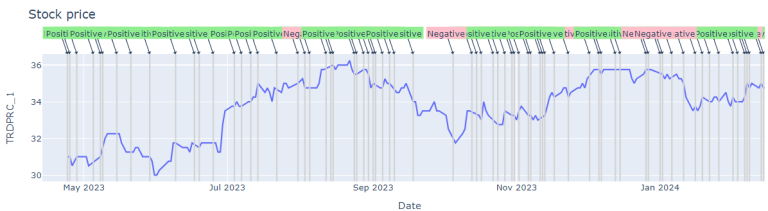
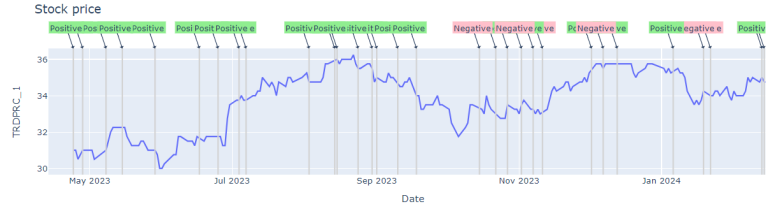
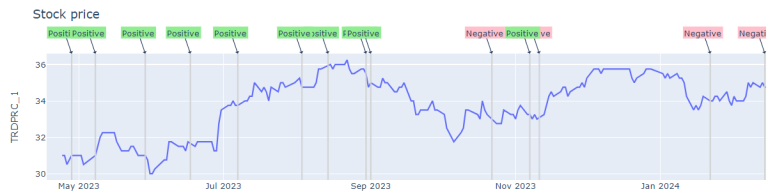
The trend of relations between news headlines sentiments and prices
With sampling news sentiments data by different fractions
from visualization import plot_price_with_news
plot_price_with_news(price_df, news_headlines_df.sample(frac=0.5, random_state=7)).show()
plot_price_with_news(price_df, news_headlines_df.sample(frac=0.2, random_state=7)).show()
plot_price_with_news(price_df, news_headlines_df.sample(frac=0.1, random_state=7)).show()
News story summarization
We can also use LLM to summarize the news story as well, for example, the code below can be used. Model BART (large-sized model), fine-tuned on CNN Daily Mail is used here
BART is a transformer encoder-encoder (seq2seq) model with a bidirectional (BERT-like) encoder and an autoregressive (GPT-like) decoder. BART is pre-trained by
- corrupting text with an arbitrary noising function, and
- learning a model to reconstruct the original text.
BART is particularly effective when fine-tuned for text generation (e.g. summarization, translation) but also works well for comprehension tasks (e.g. text classification, question answering). This particular checkpoint has been fine-tuned on CNN Daily Mail, a large collection of text-summary pairs.
# Get sample news story
story_id = 'urn:newsml:newsroom:20240617:nNRAszl6ps:0'
story = rd.news.get_story(story_id, format = rd.news.Format.TEXT)
# Summarization
summarizer = pipeline("summarization", model="facebook/bart-large-cnn")
sum_story = summarizer(story[:512], max_length=130, min_length=30, do_sample=False)
sum_story[0]['summary_text']
The summary text will be returned in field 'summary_text' as below
[{'summary_text': "PTT's stock price decreased 25.0 satang (0.8%) from its previous trading session to close at THB31.50. The last time the price hit that low level was on Wednesday, Oct 11, 2023."}]
The Future of Investment Strategies
The integration of LLMs into financial analyses marks a significant shift in how investors approach market news. By offering a deeper, more nuanced understanding of market sentiments, LLMs pave the way for more sophisticated and informed investment strategies.
You could use this example as a base to improve your trading strategies. There're many things to experiment with this approach, for example, try to adjust the prompt used in the system message, or even use the streaming pricing data as a boundary to buy or sell stocks (Example: EX-1.01.03-PricingStream.ipynb).
If you're interested in these use cases or have an idea regarding this, or even have a question on this, feel free to make a post into our Q&A Forum so we can discuss and maybe create the new example together for the community!
Conclusion
The fusion of LLMs and financial sentiment analysis represents a leap forward in investment technology. As we continue to refine these models and integrate them into our investment decision-making processes, the potential for improved accuracy and predictive power in stock market investments is immense. The journey has just begun, and the future looks promising for those ready to embrace these advanced tools.
References
- Lopez-Lira, Alejandro and Tang, Yuehua, Can ChatGPT Forecast Stock Price Movements? Return Predictability and Large Language Models (April 6, 2023). Available at SSRN: https://ssrn.com/abstract=4412788 or http://dx.doi.org/10.2139/ssrn.4412788
- FinancialBERT for Sentiment Analysis
- BART (large-sized model), fine-tuned on CNN Daily Mail
- Register or Log in to applaud this article
- Let the author know how much this article helped you