
Imagine you're building a financial application that needs to track dividends paid by the companies within major stock indices like the S&P 500, FRSE 100, or Nikkei 225. This information is crucial for a variety of financial calculations, risk assessments, and investment strategies.
However, how do you efficiently gather this data and integrate it into your Python-based application?
This article demonstrates a solution using LSEG's Data Library for Python to retrieve and analyze dividend informtaion for the constituents of various indices. We'll walk through a Python script that efficiently gathers dividend data, calculates the impact of dividends on index points, and exports the results to an Excel file for further analysis or reporting.
Why is Index Constituent Dividend Information Important?
Before diving into the code, let's highlight why this data is so valuable
- Portfolio Management: Accurate dividend information is essential for calculating portfolio returns and yield, especially for income-focused investors.
- Index Tracking: Understanding dividend payouts helps track the performance of dividend-focused indices or ETFs.
- Financial Modeling: Dividend data is used in various financial models, including discounted cash flow (DCF) analysis and dividend discount models.
- Risk Management: Changes in dividend policies can signal shifts in a company's financial health and impact risk assessments.
By efficiently accessing and processing this information, you can gain valuable insights into market trends and make more informed financial decisions.
Let's get to know the tool used here
LSEG Data Library for Python provides a set of ease-of-use interfaces offering coders uniform access to the breadth and depth of financial data and services available on the LSEG Data Platform. We're using desktop session in this article, where the data doesn’t leave the desktop, the Desktop access point allows user to access LSEG data more flexibly. (if you want more than that, i.e. beyond single applications on one desktop, or you want data to leave your desktop, the Platform session is the right solution for you. Please talk with your LSEG account representative regarding the license type.)
To get started, All you need is LSEG Workspace account and application. Simply follow the Quick Start instructions
Prerequisite
This example requires the following dependencies software and libraries.
- LSEG Workspace application with active Workspace account
- Python environment in Conda with following libraries installed (I'm using Python version 3.10.11)
- LSEG Data Library for Python: lseg.data==2.0.1
- pandas==2.2.2
- xlsxwriter==3.2.0
- dateutil==2.9.0.post0 - Internet connection
Please contact your LSEG account representative to help you to access LSEG Workspace credentials. You can generate/manage the AppKey by following the steps in the LSEG Data Library for Python Quick Start page.
Code Overview
The script is structured with modular functions for better readability and maintainability.
The key components are as below. For step 2, 3 and 5, their full code can be found in GitHub URL at the top right of this article.
0) Preparation step
1 ) Helper Functions
2) Index Data Retrieval and Processing
3) Calculating Dividend Impact
4) Multithreading
5) Excel Export
6) Example Usage
0) Preparation step
Import necessary libraries, open session to retrieve data from LSEG.
import datetime as dt
import time
from concurrent.futures import ThreadPoolExecutor
from threading import Lock
from typing import Union
import pandas as pd
from dateutil.relativedelta import relativedelta
import xlsxwriter
import lseg.data as ld
import lseg.data.content.ipa.financial_contracts as ldf
from lseg.data.content.ipa.financial_contracts import cross
pd.set_option('future.no_silent_downcasting', True)
config = ld.get_config()
config.set_param("http.request-timeout", 300) # 5 min
ld.open_session()
Then, define constant variables for fields and columns name to be used
EX_DATE_FLD = "TR.DivExDate"
INDEX_CONSTITUENT_SHARES_FLD = "TR.IndexConstituentShares"
DIVIDEND_PAYMENT_TYPE_FLD = "TR.DivPaymentType"
INDEX_CONSTITUENT_RIC = "TR.IndexConstituentRIC"
INDEX_CURRENCY_FLD = "AVAIL(TR.CLOSEPRICE.CURRENCY,TR.INDEXCALCULATIONCURRENCY)"
INDEX_DIVISOR_FLD = "TR.IndexDivisor"
INDEX_NAME_FLD = "TR.IndexName"
CLOSE_PRICE_FLD = "TR.ClosePrice"
CLOSE_PRICE_FLD_CURR = "TR.ClosePrice(Curn={})"
# Some columns used below by the dataframe
INSTRUMENT_RIC_COL = "Instrument"
DIVIDEND_EX_DATE_COL = "Dividend Ex Date"
CONSTITUENT_RIC_COL = "Constituent RIC"
INDEX_CURRENCY_COL = "Calculation Currency"
INDEX_DIVISOR_COL = "Index Divisor"
OUTSTANDING_SHARES_COL = "Company Shares"
INDEX_SHARES_COL = "Index Shares"
DIVIDEND_AMOUNT_COL = "Adjusted Gross Dividend Amount"
DIVIDEND_PAYMENT_TYPE = "Dividend Payment Type"
INDEX_NAME_COL = "Index Name"
CLOSE_PRICE_COL = "Close Price"
RIC_COL = "RIC"
EX_DATE_COL = "Ex-Date"
DIVIDEND_COL = "Dividend"
CURRENCY_COL = "Currency"
DIVIDEND_CURRENCY_COL = "Dividend Currency"
# Renamed columns
DIVIDEND_INDEX_POINTS = "Div (Ind. Points)"
BENCHMARK_INDEX = "Benchmark Index"
BENCHMARK_INDEX_NAME = "Benchmark Index Name"
AGG_COL_1 = "No. of Company Xdiv"
AGG_COL_2 = "Div (Ind. Pts)"
DIVIDEND_IN_INDEX_CURRENCY = "Dividend in ({})"
# Fx Rates requested fields
FXCROSSCODE = "FxCrossCode"
FXCROSSSCALINGFACTOR = "FxCrossScalingFactor"
VALUATION_DATE = "ValuationDate"
FXSPOT = "FxSpot"
ERRORCODE = "ErrorCode"
1 ) Helper Functions
- get_lseg_data(universe, fields, parameters): This function handles data retrieval from LSEG, incorporating retry logic to ensure robustness.
def get_lseg_data(universe: Union[str, list], fields: Union[str, list] = [], parameters: Union[str,dict] = {}) -> pd.DataFrame:
res = pd.DataFrame()
nb_relaunch_request = 5
succeed = False
time.sleep(1) # one second delay before a call to the back-end
while not succeed and nb_relaunch_request > 0:
try:
res = ld.get_data(universe, fields, parameters)
except Exception as ex:
nb_relaunch_request -= 1
time.sleep(0.2)
else:
succeed = True
return res
- create_error_dataframe(index_ric, error_message): Create a Dataframe to store any errors encountered.
def create_error_dataframe(index_ric, error_message):
return pd.DataFrame({"Index": index_ric, "Error Message": error_message}, index = [0])
2) Index Data Retrieval and Processing
Full code can be found in GitHub URL at the top right of this article
- _fetch_index_data(index_ric): Fetches basic information about the index, including its constituents, currency, and divisor.
- _fetch_constituent_dividends(index_ric, index_constituent_rics, index_currency, valuation_date_str, use_prev_fx_rate): Retrieves dividend data (ex-dates, amounts, payment types) for all constituents of the index.
- _apply_fx_rates_to_dividends(div_details, index_currency, fx_rates, market_data_date, use_prev_fx_rate, locker): Handles currency conversion for dividends, ensuring they are expressed in the index currency.
- _calculate_index_divisor(index_ric, index_close_price, index_constituent_rics, index_currency, start_time, constituent_shares_df): Calculates the index divisor if it's not directly available.
3) Calculating Dividend Impact
Full code can be found in GitHub URL at the top right of this article
- get_dividend_details(index_ric, use_prev_fx_rate, fx_rates, market_data_date, locker): This function orchestrates the retrieval and processing of dividend data, calculates the impact of dividends on index points, and applies necessary FX rate conversions.
def get_dividend_details(index_ric, use_prev_fx_rate, fx_rates, market_data_date, locker):
//
# step 0) initialize variables
try:
# step 1) fetch index data
# extract index information from df
# handle missing index currency
# populate index_info DataFrame
# prepare constituent shares DataFrame
# step 2) fetch constituent dividends
# step 3) process dividend data
# Get only the latest dividend amount and group them
# group by RIC, currency, dividend amount, payment type - then get max ex-date
# group by RIC, ex-date, currency, payment type - then sum dividend amount
# merge with constituent shares
# fill missing dividend and outstanding shares with 0
# step 4) apply fx rates and extract fx rates used
# step 5) calculate index divisor (if needed)
# If the index divisor is not provided, use the formula: index_divisor = (sum (outstanding_shares * stock_close_price)) / index_close_price
# step 6) calculate dividend impact
# select relevant columns from div_details based on use_prev_fx_rate
//
except ValueError as e:
print(e)
error_details = create_error_dataframe(index_ric, error_message)
return index_info, div_details, error_details, fx_rates_dict
4) Multithreading
- get_dividends_details(index_rics_constituents, use_prev_fx_rate, valuation_date): Utilizes ThreadPoolExecutor to process multiple indices concurrently, improving performance.
def get_dividends_details(index_rics_constituents, use_prev_fx_rate, valuation_date):
index_infos_lst = []
div_details_lst = []
err_details_lst = []
fx_rates_lst = []
fx_rates_dico = {}
lock = Lock()
with ThreadPoolExecutor(max_workers = None) as executor:
nb_loop = len(index_rics_constituents)
locker_lst = []
for i in range (nb_loop):
locker_lst.append(lock)
for index_info, div_details, err_details, fx_rates_details in executor.map(get_dividend_details,
index_rics_constituents,
[use_prev_fx_rate] * nb_loop,
[fx_rates_dico] * nb_loop,
[valuation_date] * nb_loop,
locker_lst):
index_infos_lst.append(index_info)
div_details_lst.append(div_details)
err_details_lst.append(err_details)
fx_rates_lst.append(fx_rates_details)
errors_df = pd.DataFrame()
for err_df in err_details_lst:
if len(err_df) > 0:
errors_df = pd.concat([errors_df, err_df], ignore_index=True)
return index_infos_lst, div_details_lst, errors_df, fx_rates_lst
5) Excel Export
Full code can be found in GitHub URL at the top right of this article
- write_sheet(wb, index_info_df, div_summary_df, div_details_item, sheetname, title, fx_rates_info): Exports the results to an Excel file, including formatting, charts, and summaries.
# Writes a well formatted Excel sheet
def write_sheet(wb, index_info_df, div_summary_df, div_details_item, sheetname, title, fx_rates_info):
// full code can be found in GitHub URL at the top right of this article
print(f"Process finished! Exporting to Excel...!")
# Export to Excel
EXCEL_FILENAME_XLS = f"Index_Dividends_{start_date_str}.xlsx"
EXCEL_ERROR_FILENAME_XLS = f"Index_Dividends_Errors_{start_date_str}.xlsx"
# Create a workbook
workbook = xlsxwriter.Workbook(EXCEL_FILENAME_XLS, {"nan_inf_to_errors": True, "strings_to_numbers": True})
for idx in range(len(div_details_lst)):
div_details_item = div_details_lst[idx]
if len(div_details_item) == 0:
continue
# Filter by date
div_summary_df = div_details_item[div_details_item[EX_DATE_COL] >= start_date_str]
div_summary_df = div_summary_df[div_summary_df[EX_DATE_COL] <= end_date_str]
# Group the dividend value by date
div_summary_df = div_summary_df.groupby([EX_DATE_COL])[DIVIDEND_INDEX_POINTS].agg(['sum','count'])
div_summary_df.rename(columns = {'count' : AGG_COL_1, 'sum' : AGG_COL_2}, inplace = True)
index_info_df = index_info_lst[idx]
sheet_name_label = index_info_df.loc[0, BENCHMARK_INDEX]
sheet_title = f"{sheet_name_label} - Dividend Index Points"
# Get the Fx Rates
fx_rates_info = fx_rates_lst[idx]
div_details_item.replace({pd.NaT: None}, inplace=True)
index_info_df.replace({pd.NaT: None}, inplace=True)
write_sheet(workbook, index_info_df, div_summary_df, div_details_item, sheet_name_label, sheet_title, fx_rates_info)
workbook.close()
if(not error_details_df.empty):
# Write the error file
error_details_df.to_excel(EXCEL_ERROR_FILENAME_XLS, index = False)
print(f"Process finished!")
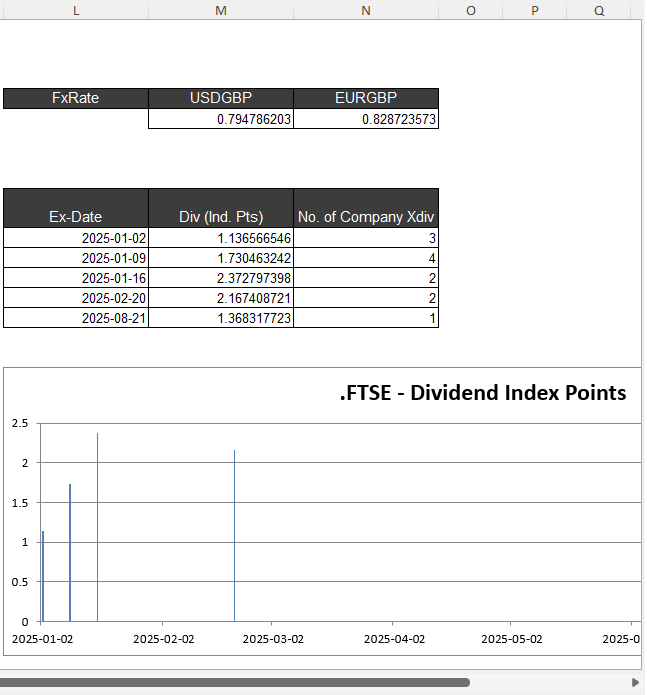
The example sheet of output Excel File is as below


6) Example Usage
index_rics_constituents = ['.SPX', '.FTSE', '.N225']
index_info_lst = []
div_details_lst = []
error_details_df = []
fx_rates_lst = []
today = dt.datetime.today()
start_date = dt.datetime(today.year, today.month, today.day)
end_date = start_date + relativedelta(years=1)
start_date_str = start_date.strftime('%Y-%m-%d')
end_date_str = end_date.strftime('%Y-%m-%d')
use_previous_fx_rate = True
if __name__ == '__main__':
# Return a dataframe which contain the dividend details
index_info_lst, div_details_lst, error_details_df, fx_rates_lst = get_dividends_details(index_rics_constituents, use_previous_fx_rate, today)
ld.close_session()
## Then export to excel with code from step 5) Excel Export
Output of the script
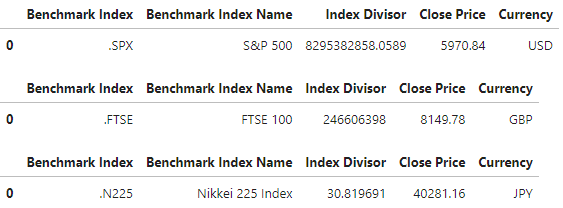
The script produces 4 output DataFrames. The first output are Dataframes of index's information.
for index_info in index_info_lst:
display(index_info)

The second output are DataFrames of Dividend details.
for div_details in div_details_lst:
display(div_details.head(3))

The third output is error details dataframe, which is empty because there's no error occured here.
The forth output is a list of FX rates as below.
print(fx_rates_lst)
[{}, {'USDGBP': 0.794786202511524, 'EURGBP': 0.828723573358766}, {}]
Key Considerations
These are things that being handled in the script.
- Error Handling: The script includes error handling to catch potential issue like network problems or missing data.
- Efficiency: Multithreading is used to process multiple indices concurrently, enhancing performance.
- Data Consistency: The script handles currency conversions to ensure consistent reporting in the index currency.
- Maintainability: The modular structure with functions improves code organization and maintainability.
Conclusion
This article provides a practical example of how to use the LSEG data library and Python to retrieve and analyze dividend information for index constituents. The provided script can be adapted and extended to meet specific analytical requirement, offering a valuable tool for any developers wotking with financial data.
- Register or Log in to applaud this article
- Let the author know how much this article helped you
