


Overview
Due to this DA (Data Notification) DN092084-Decommission of ECON chains from Workspace effective on 30 September 2017, we are moving away from the previous Country Economic Indicator chains to apps that are fully customizable and leverage on the depth of content that is available. For example, these chains have a fixed view and users cannot change which columns they want to see or don’t want to see. Whereas the Economic Monitor app on Workspace allows full customization to view the calendar of releases. For example, users can customize the following:
- List of countries
- Range of dates for events
- View only a customized set of indicators
- Alter the position of column
- Add and remove the columns
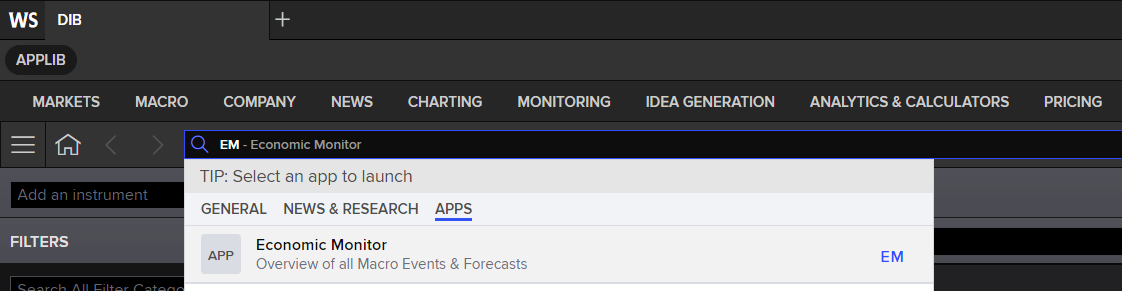
To access Economic Monitor app, Type EM in the Workspace Search box and hit Enter, to launch the app.
The Economic Monitor provides distinct advantages over the old ECON pages. These are listed below:
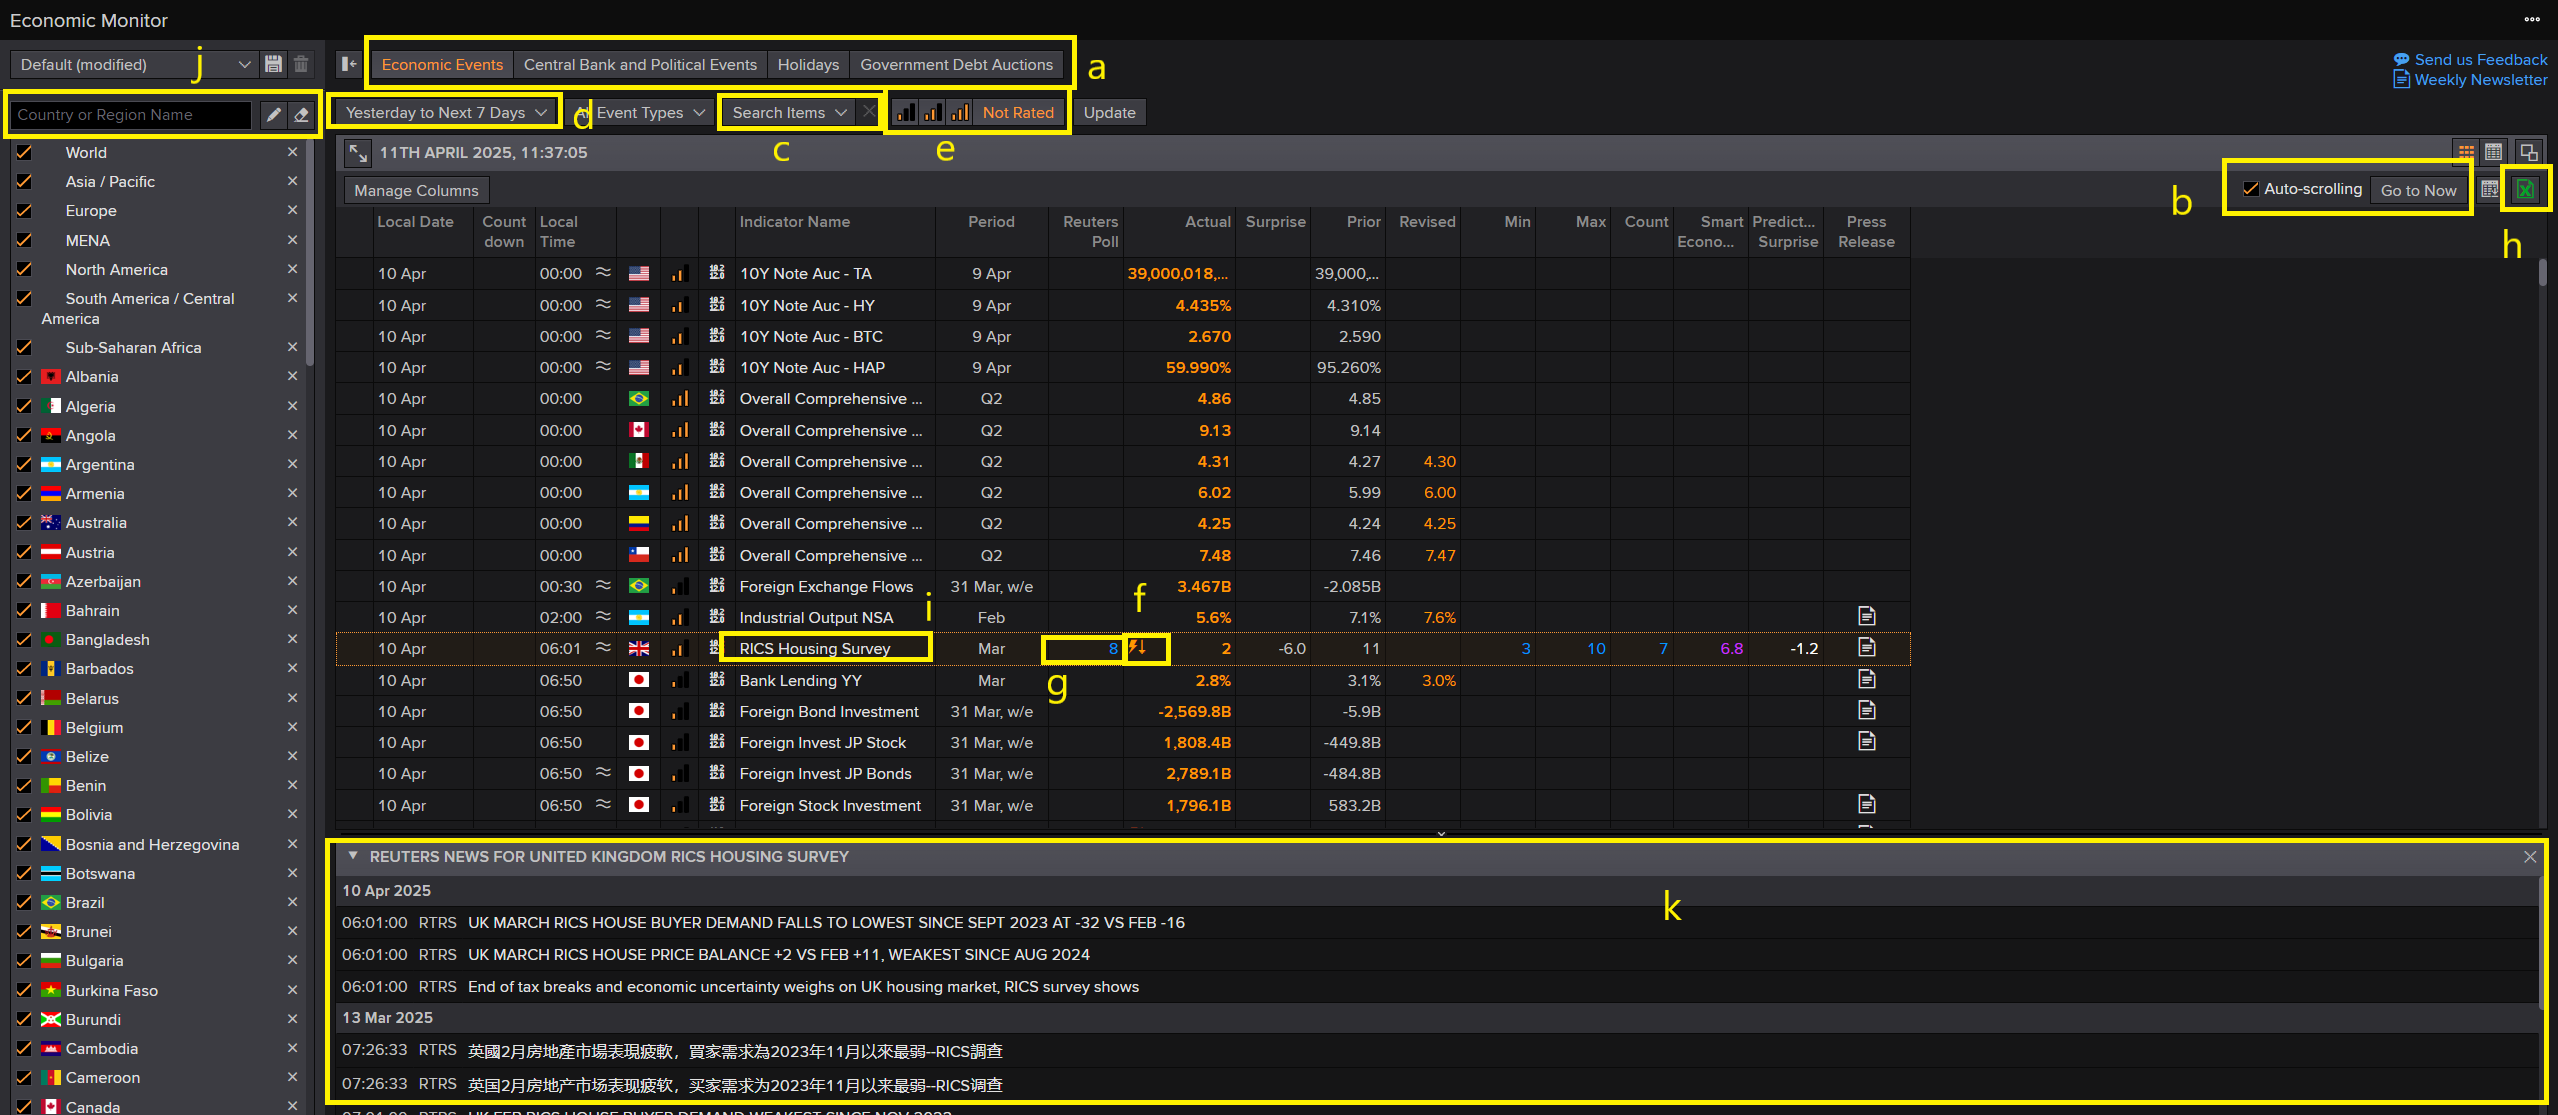
a) You can select the events that you'd like to see, which are as follows:
- Economic Events
- Central Bank and Political Events - in year calendar format.
- Holidays - year calendar - Includes FX specific holidays
- Government debt auctions - listed by recent auction results / upcoming auctions
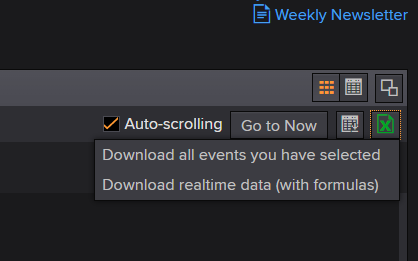
b) Hands-free auto-scrolling. Whilst you can scroll up and down to look at past / future events, you can always quickly return to what’s happening now by hitting ‘Go to now’
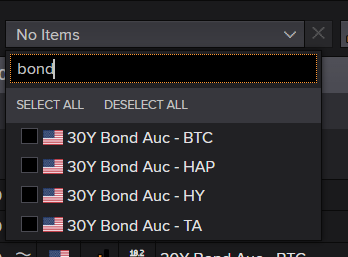
c) Search Items
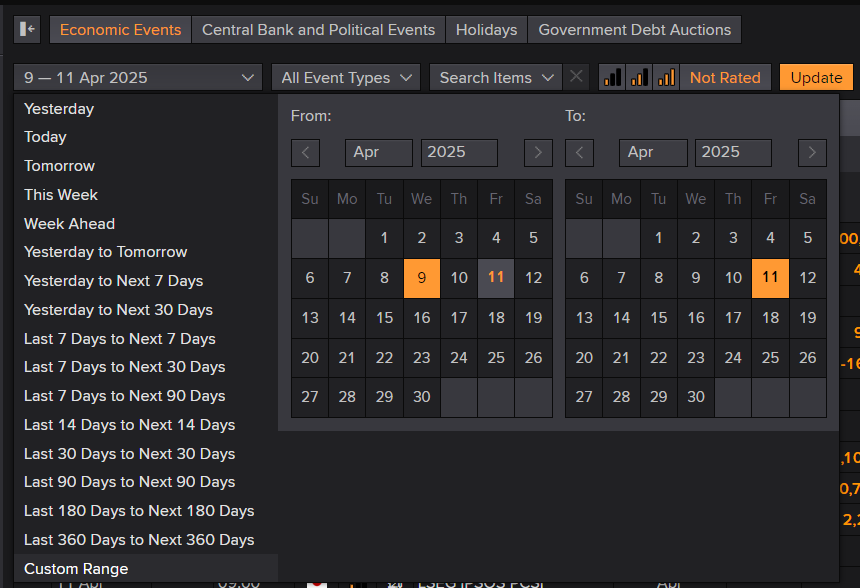
d) Select how much data you want to see (how far back / forwards in time)
e) Market Relevance indicators. You can filter on these
f) Shockwave is pictured immediately on release of a number which comes out outside of expectation
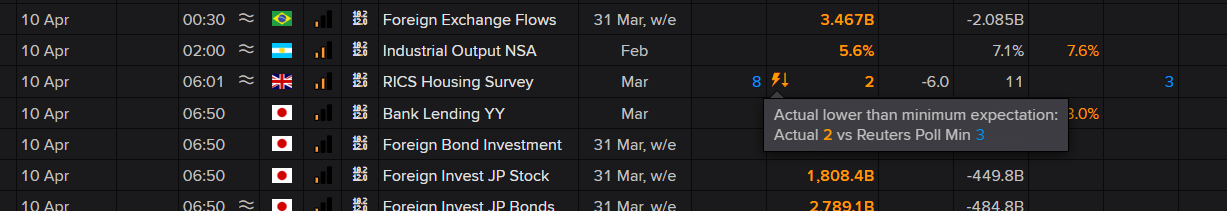
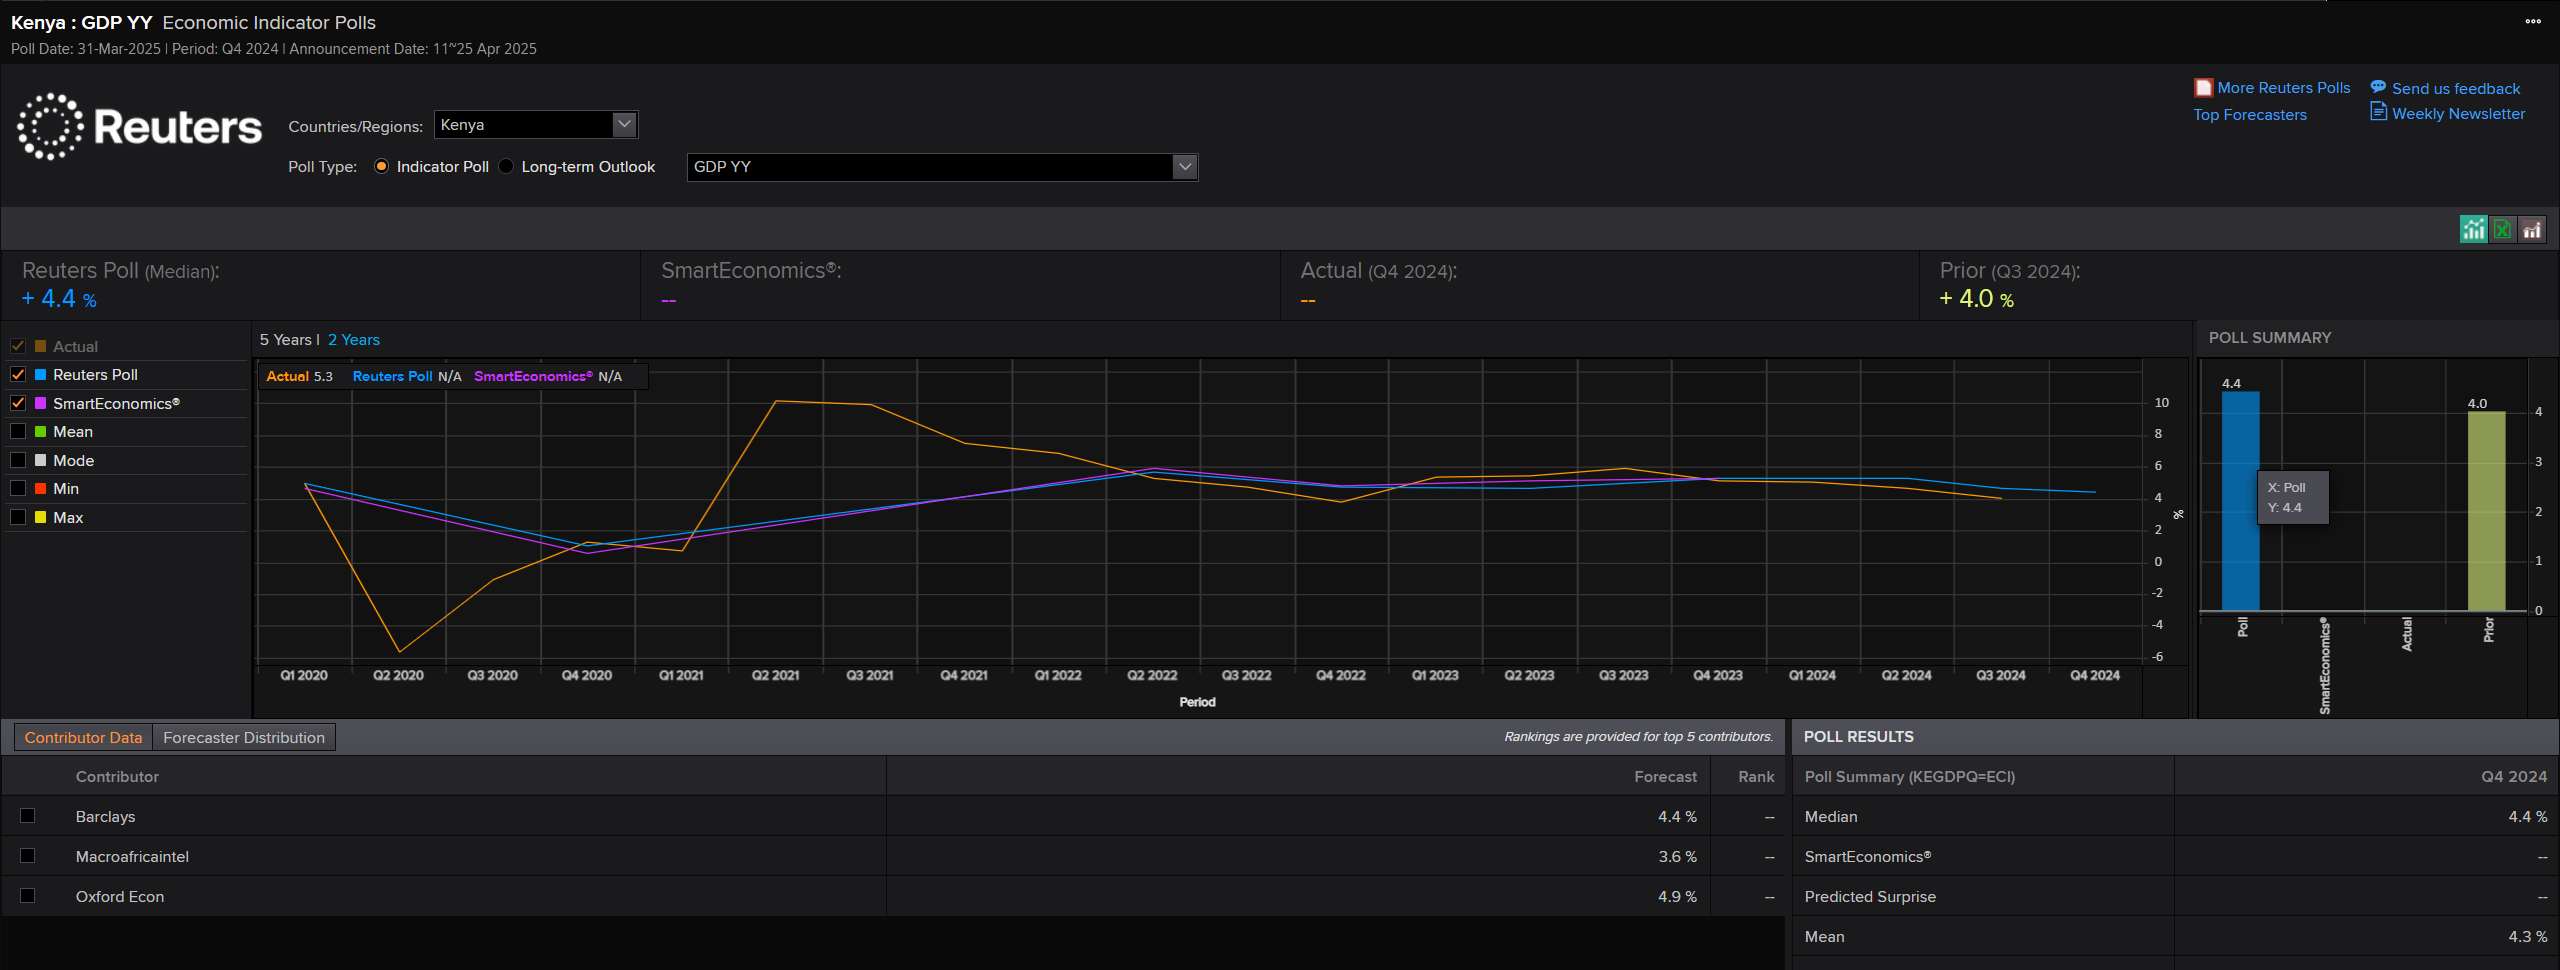
g) Reuters Poll provides expected value of the upcoming release. Drill down to see the detail of the poll
h) Export to Excel
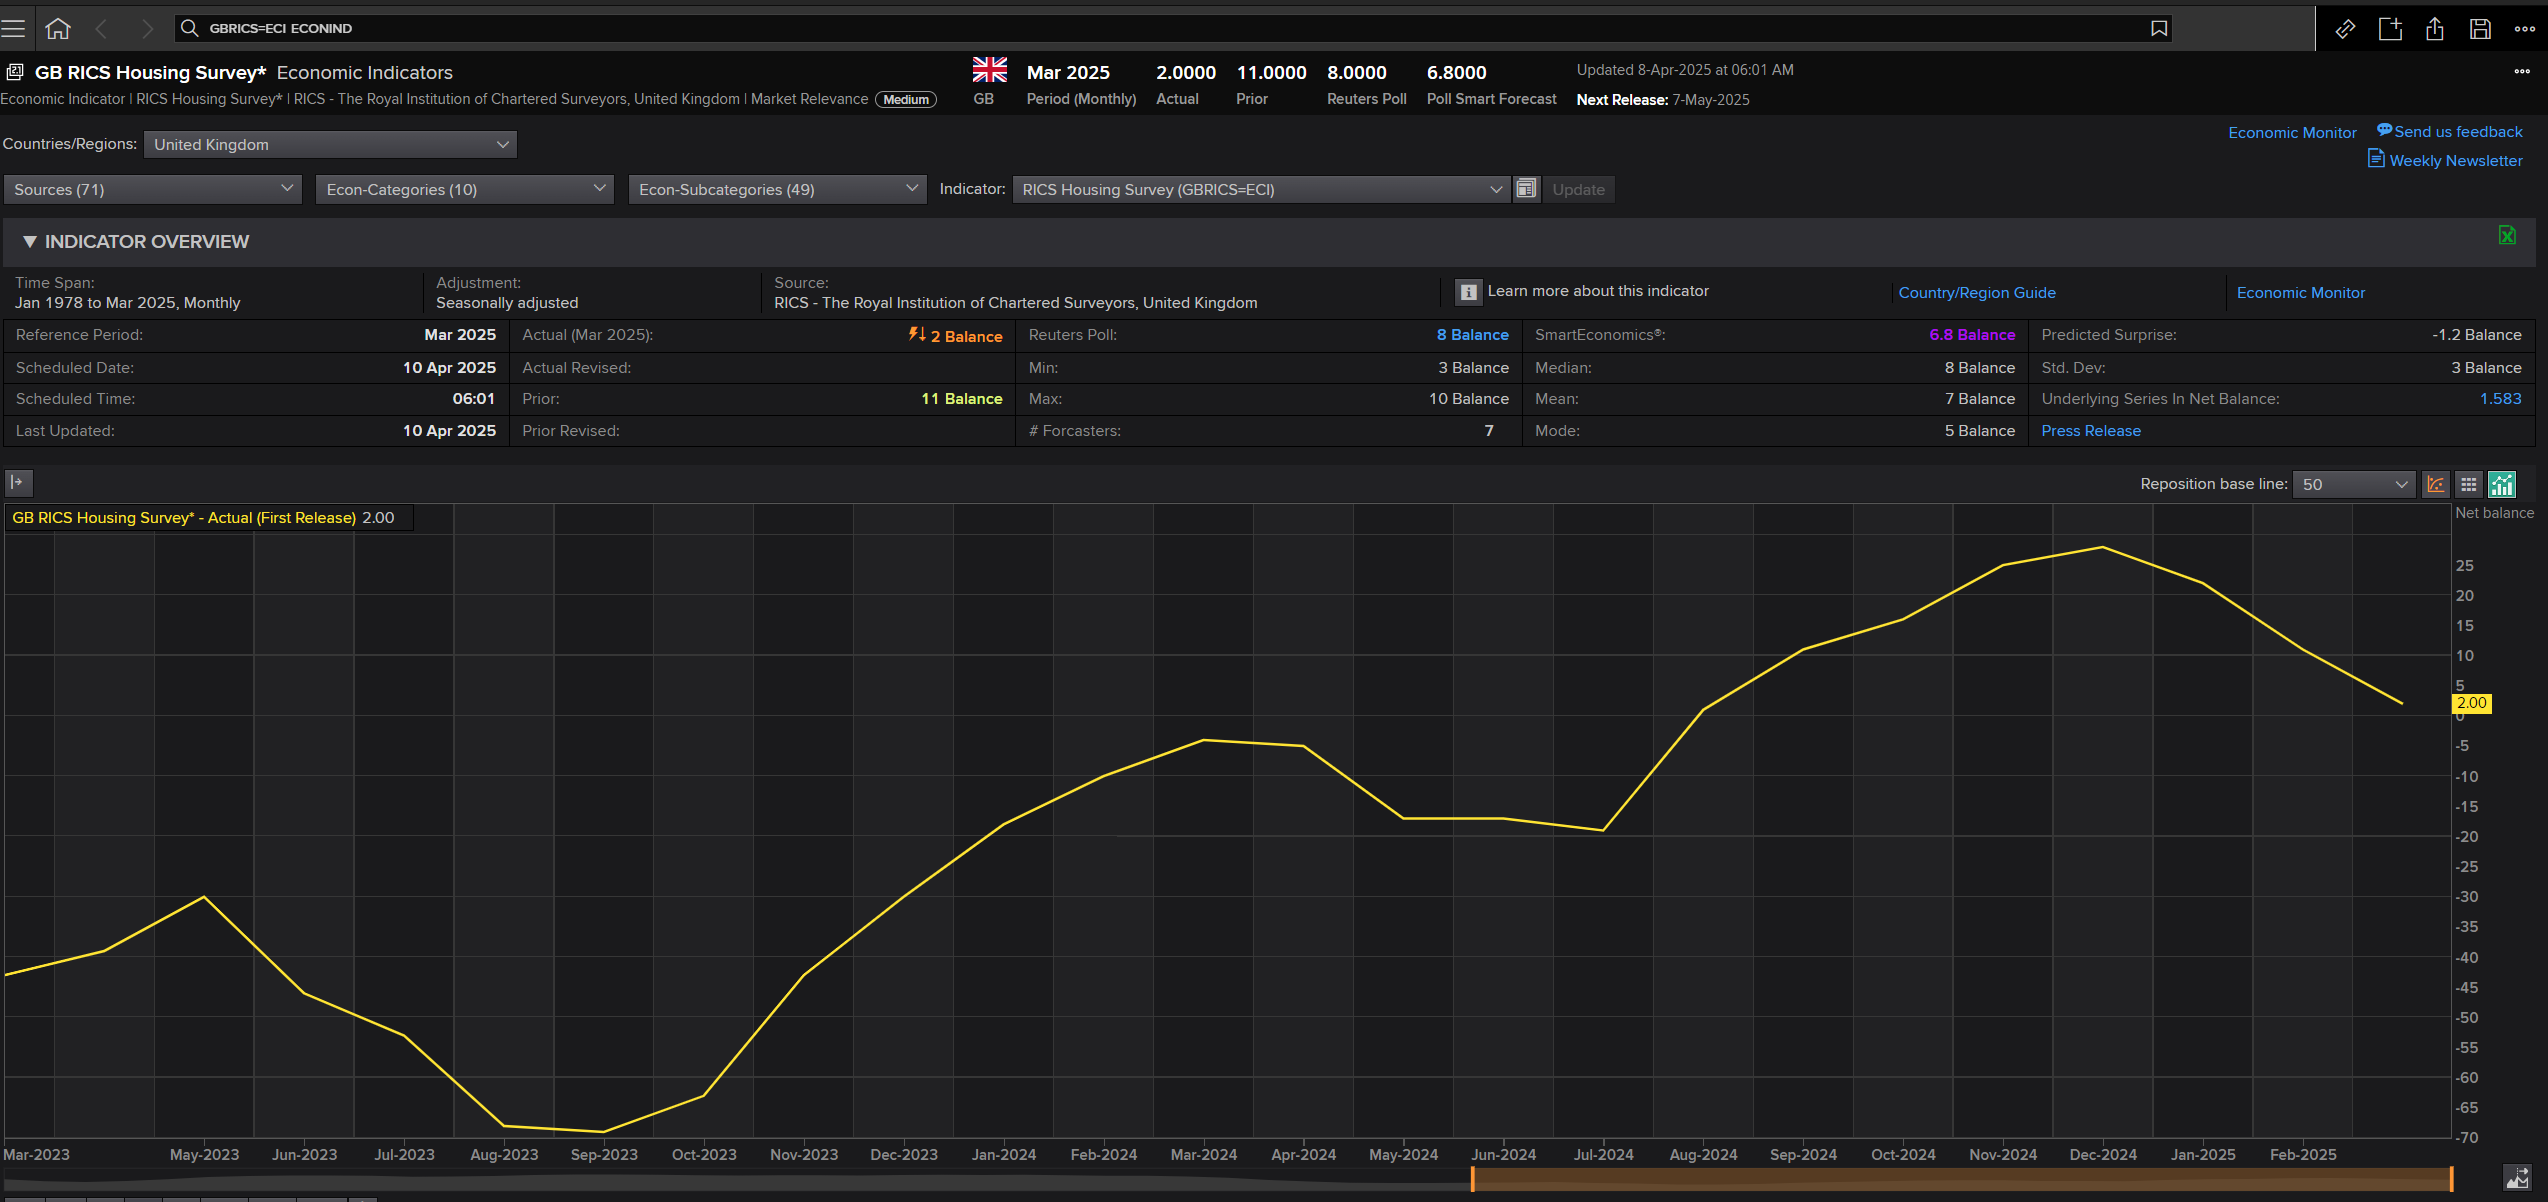
i) View the detail of an indicator by clicking on its description. See the historical chart, the press release etc.
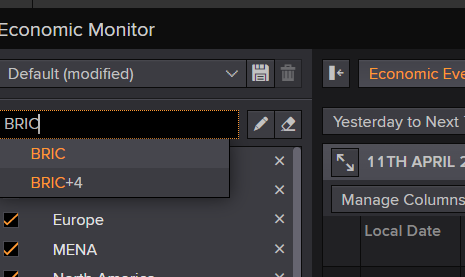
j) Fully customizable. Create your own country set-ups (eg ASEAN week ahead, US Today, BRIC month ahead etc.)
k) Real-time news stories as announcements are made
Now, what about using this app to extract a list of Economic Indicator RIC to be used to retrieve economic data?
Getting Economic Indicator RIC
This article uses "Hong Kong" to demonstrate the process to retrieve the cross economic data. To get the Economic event RICs in Hong Kong, you can follow the steps below
- Click the j) button, select the country Hong Kong
- You can also save the current profile as a list of country you would like to monitor
- Select how much data you want to see (how far back / forwards in time)
- Click 'Update' to retrieve the data based on the country selected
- Click 'Export to Excel' button > Download all events you have selected
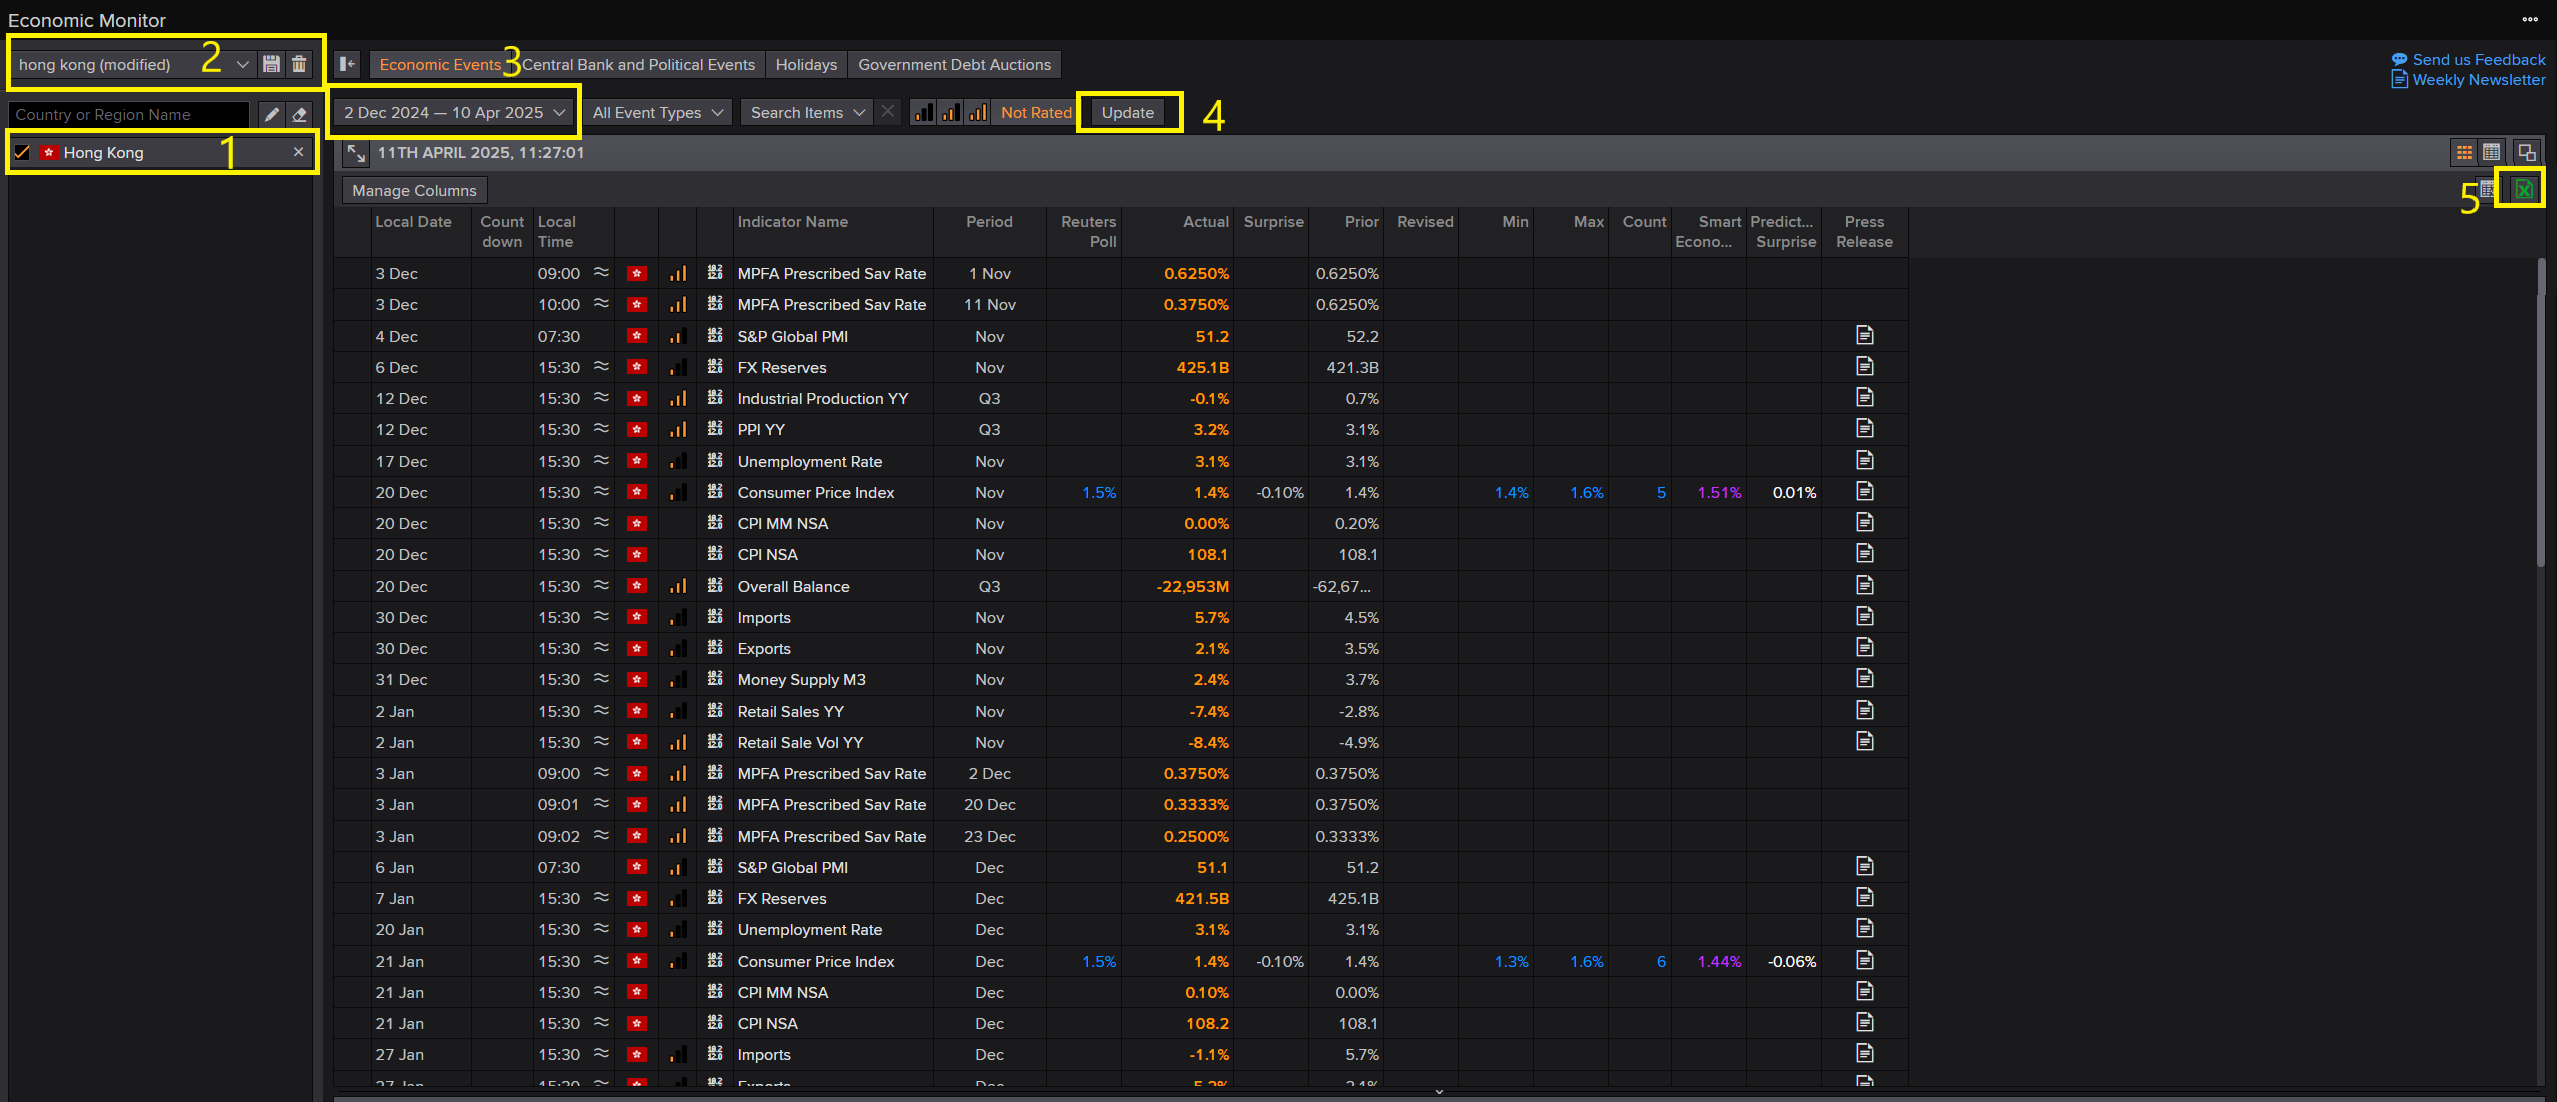
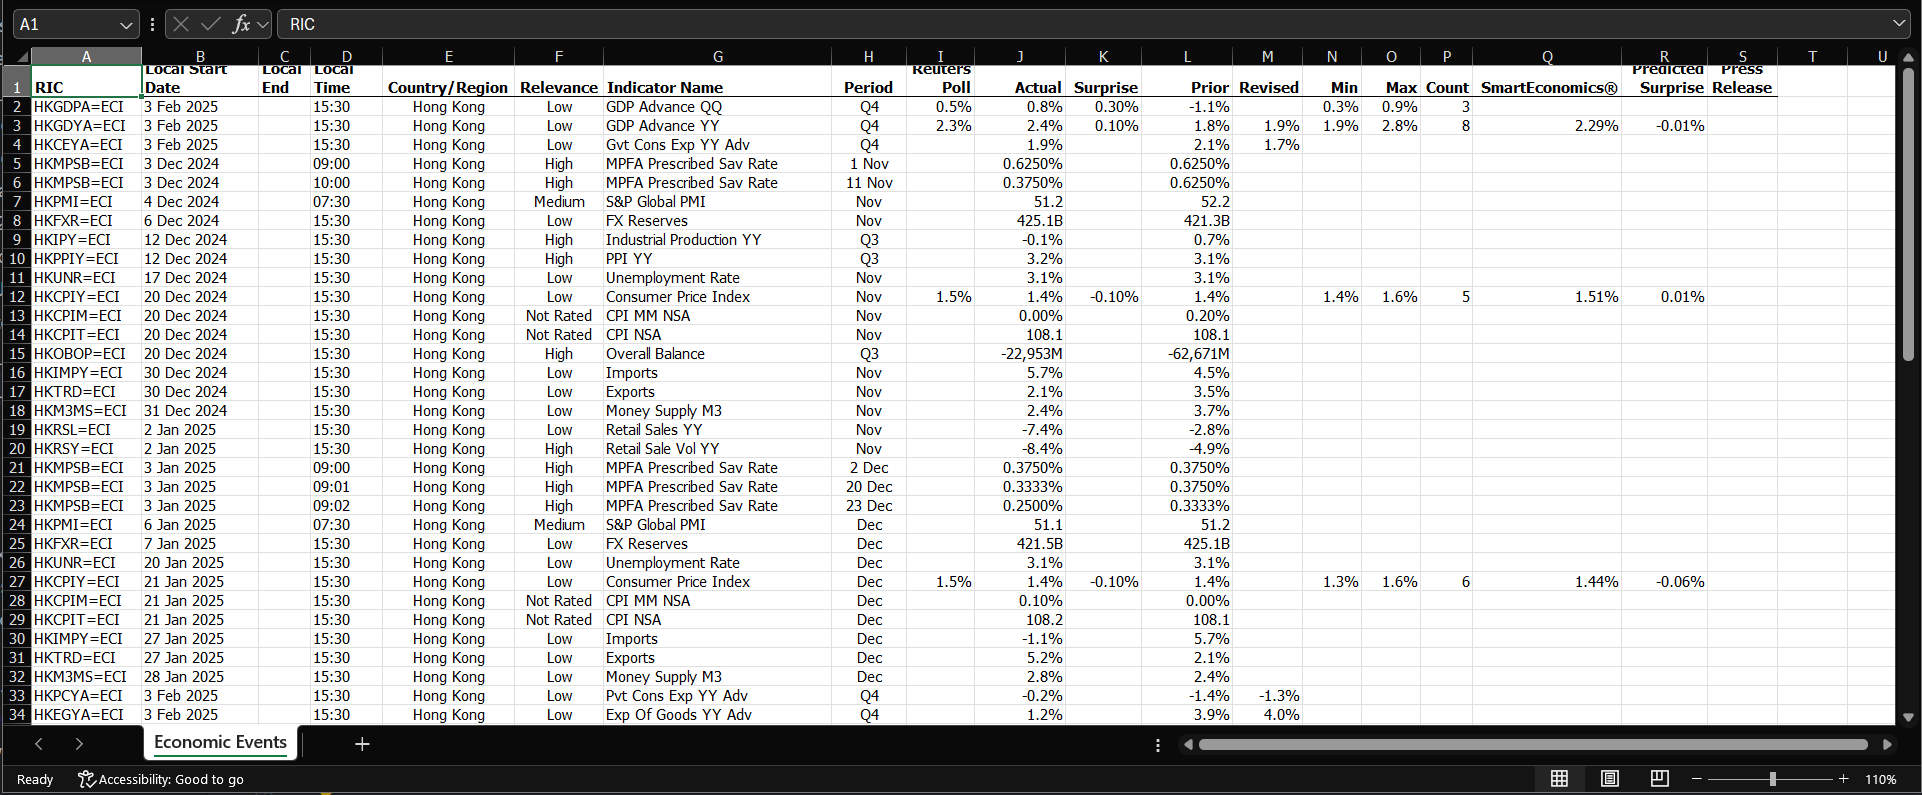
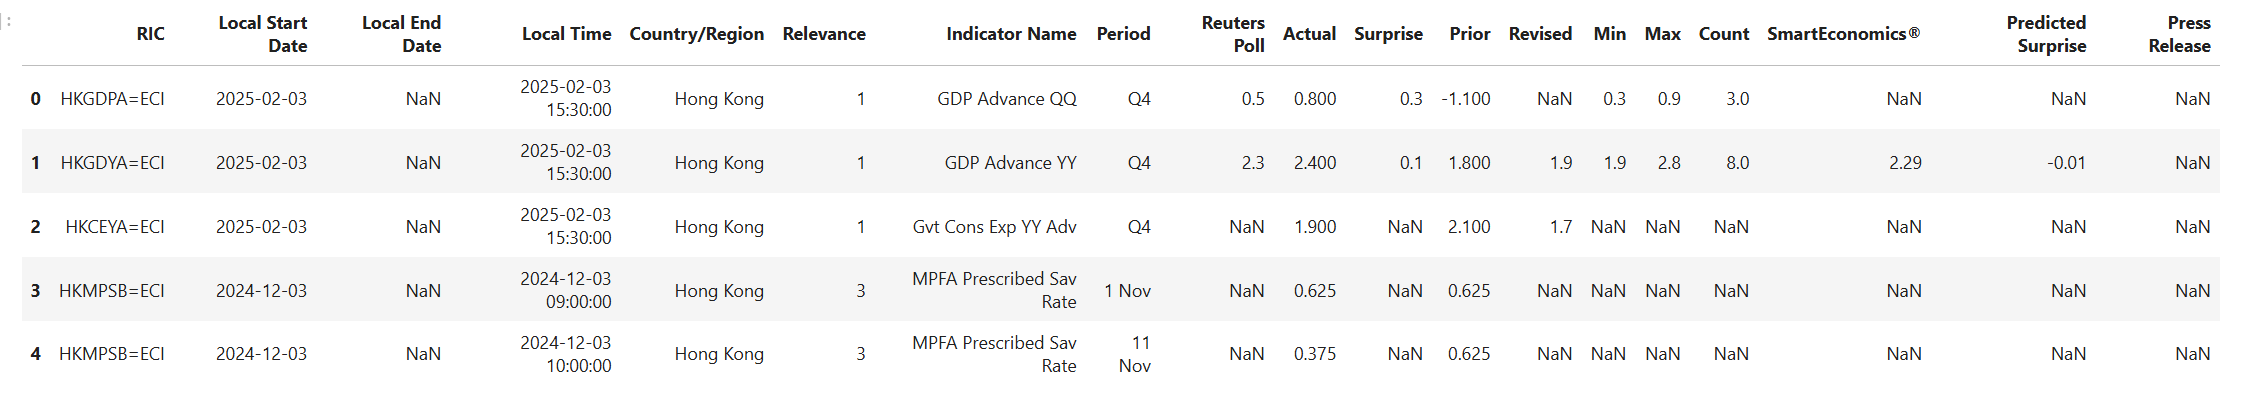
The 'Economic Events' Excel file will be downloaded, Economic Indicator RICs of Hong Kong are included in this file (in RIC column).
Introduction to the Data Library for Python
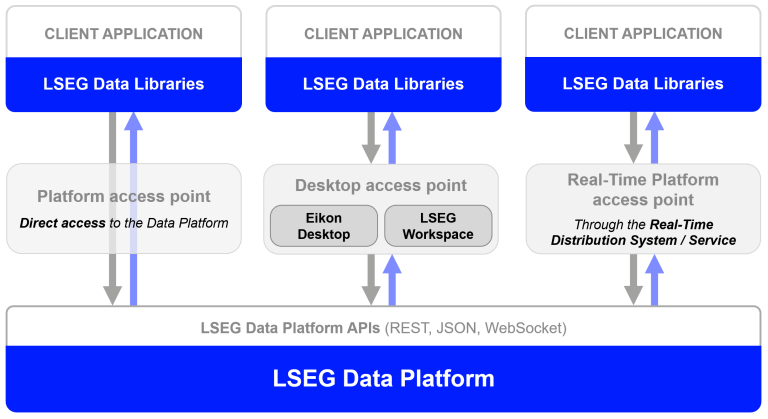
Let me start by give you an introduction to the Data Library. The Data Library for Python provides a set of ease-of-use interfaces offering coders uniform access to the breadth and depth of financial data and services available on the Workspace, RDP, and Real-Time Platforms. The API is designed to provide consistent access through multiple access channels and target both Professional Developers and Financial Coders. Developers can choose to access content from the desktop, through their deployed streaming services, or directly to the cloud. With the Data Library, the same Python code can be used to retrieve data regardless of which access point you choose to connect to the platform.
The Data Library are available in the following programming languages:
For more deep detail regarding the Data Library for Python, please refer to the following articles and tutorials:
Disclaimer
This article is based on Data Library Python versions 2.1.1 using the Desktop Session only.
That covers an overview of the Data Library
The Coding part
Step 1: From the downloaded Excel file, a list of Economic Indicator RICs can be extracted using the Python code below. (in this article, the Excel file is placed in the same directory as an application file).
import pandas as pd
# to set the number of DF rows to be displayed
pd.set_option('display.max_rows', None)
# [Step 1] Loading Excel file into dataframe
# (the Excel file can be downloaded from Economic monitor app - check article for more detail)
indicator_df = pd.read_excel('Economic Events.xlsx')
indicator_df.head()
Step 2: Then let's extract RIC codes from RIC column and make it a list of RICs
hk_indicators = indicator_df['RIC'].tolist()
# print only examples
print(hk_indicators[0:10] )
['HKGDPA=ECI', 'HKGDYA=ECI', 'HKCEYA=ECI', 'HKMPSB=ECI', 'HKMPSB=ECI', 'HKPMI=ECI', 'HKFXR=ECI', 'HKIPY=ECI', 'HKPPIY=ECI', 'HKUNR=ECI']
Step 3: Retrieve the cross economic data from Eikon Data API
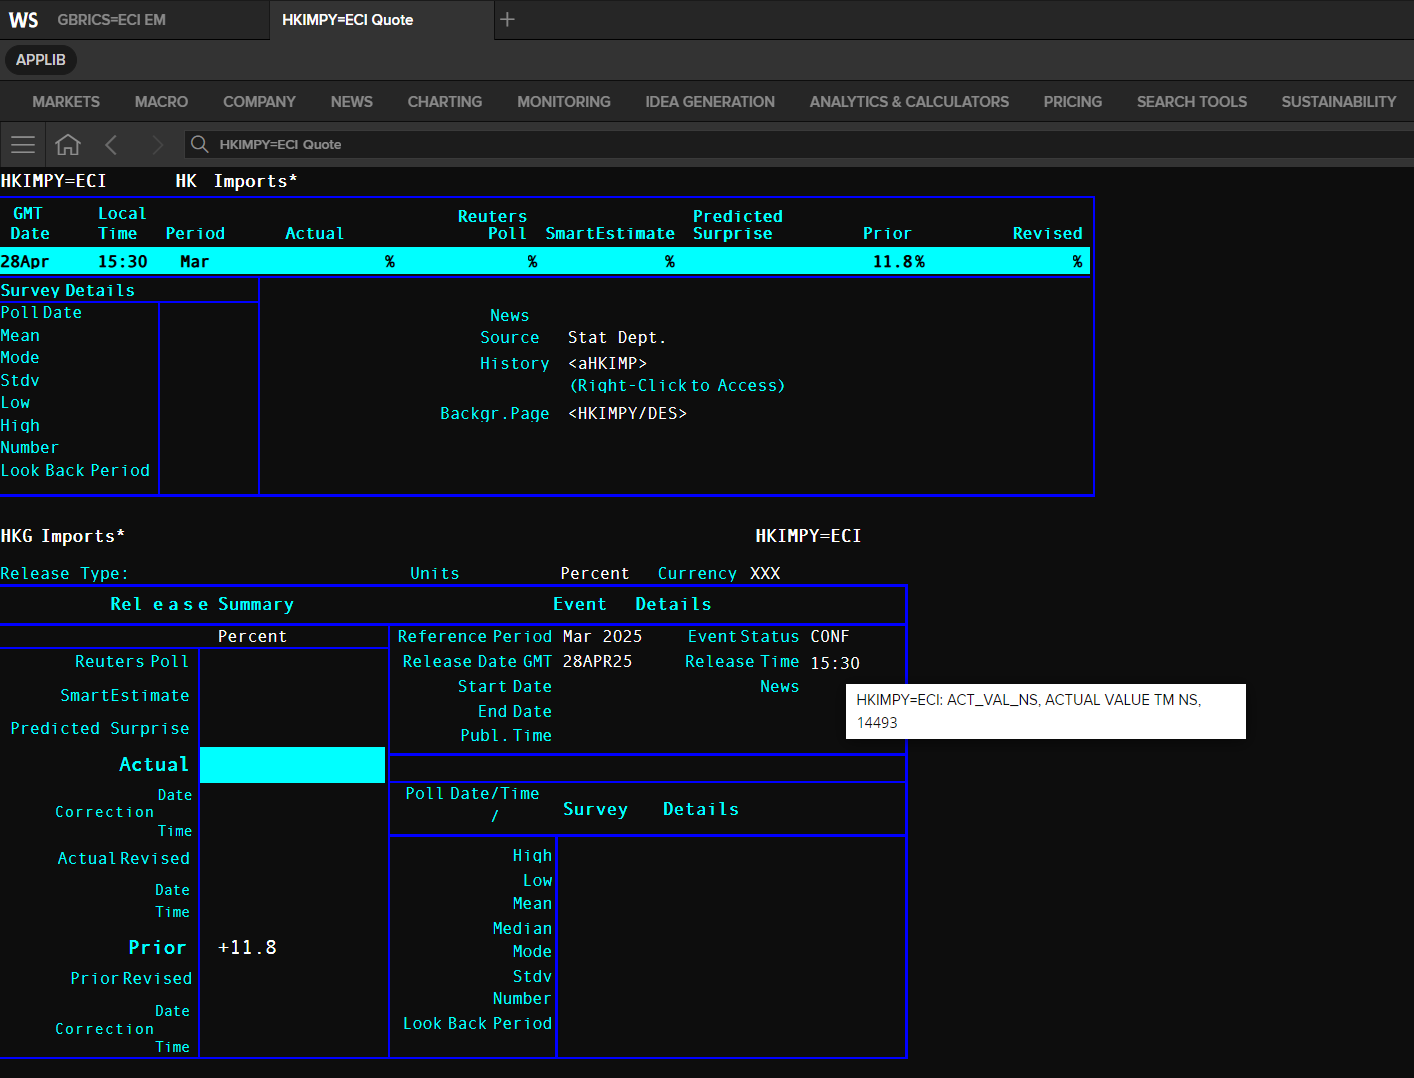
We are using the realtime quote model for economic indicators here and you can see its field name by typing a realtime RIC, such as HKIMPY=ECI and access its in Quote app. Then hover the mouse over a particular value, the field name will be shown.
As an example below, the field name of Release Time is ACT_VAL_NS.
Here is the sample code to retrieve the values for each Economic Indicator RIC code:
Let start with importing the required libraries. The application needs to import lseg.data library in order to interact with Data library.
import lseg.data as ld
The next step is to open a session defined in a lseg-data.config.json configuration file in the same location as an application file.
You should save a json file lseg-data.config.json having your Workspace App Key as follows:
{
"logs": { ... },
"sessions": {
"default": "desktop.workspace",
"desktop": {
"workspace": {
"app-key": "YOUR APP KEY GOES HERE!"
}
}
}
}
This file should be readily available (e.g. in the current working directory) for the next steps.
Please note that the LSEG Workspace desktop application integrates the API proxy that acts as an interface between the Data library and the Workspace Platform. For this reason, the Workspace application must be running when you use the Data library with Desktop Session.
Open the data session
The open_session() function creates and open sessions based on the information contained in the lseg-data.config.json configuration file. Please edit this file to set the session type and other parameters required for the session you want to open.
ld.open_session()
# example output <lseg.data.session.Definition object at xxxx {name='workspace'}>
The get_data() method allows you to retrieve pricing snapshots as well as Fundamental & Reference data via a single method call.
You can use Python built-in help() method or check the Reference Guide to check how to use the method.
help(ld.get_data)
The method returns a pandas.DataFrame with fields in columns and instruments as row index. It raises exceptions on error and when no data is available.
# Retrieve data point on each Economic Indicator
fields = ['TR.IndicatorName','TR.IndicatorType','TR.IndicatorSource'
,'ECI_ACT_DT' # GMT Date
,'ACT_VAL_NS' # Time
,'FCAST_PRD' # Period
,'ECON_ACT' # Actual
,'RTR_POLL' # Reuters Poll
,'ECON_PRIOR' # Prior
,'ECON_REV' # Revised
]
df = ld.get_data(
universe=hk_indicators,
fields=fields
)
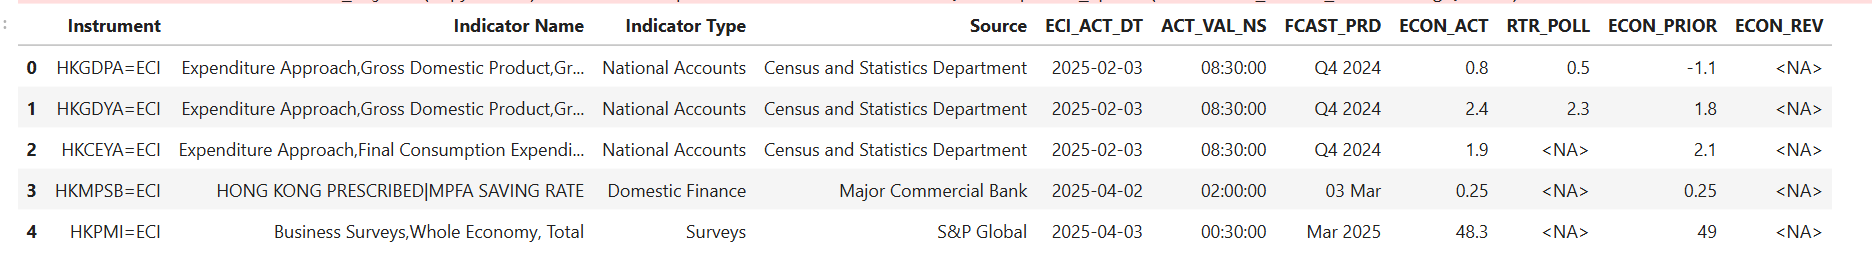
df.head()
Next, we rename our data column for easier to read, and then display all data.
# Rename dataframe columns
df.rename(columns={'ECI_ACT_DT':'GMT Date'
,'ACT_VAL_NS':'Time'
,'FCAST_PRD':'Period'
,'ECON_ACT':'Actual'
,'RTR_POLL':'Reuters Survey'
,'ECON_PRIOR':'Prior'
,'ECON_REV':'Revised'
},inplace=True)
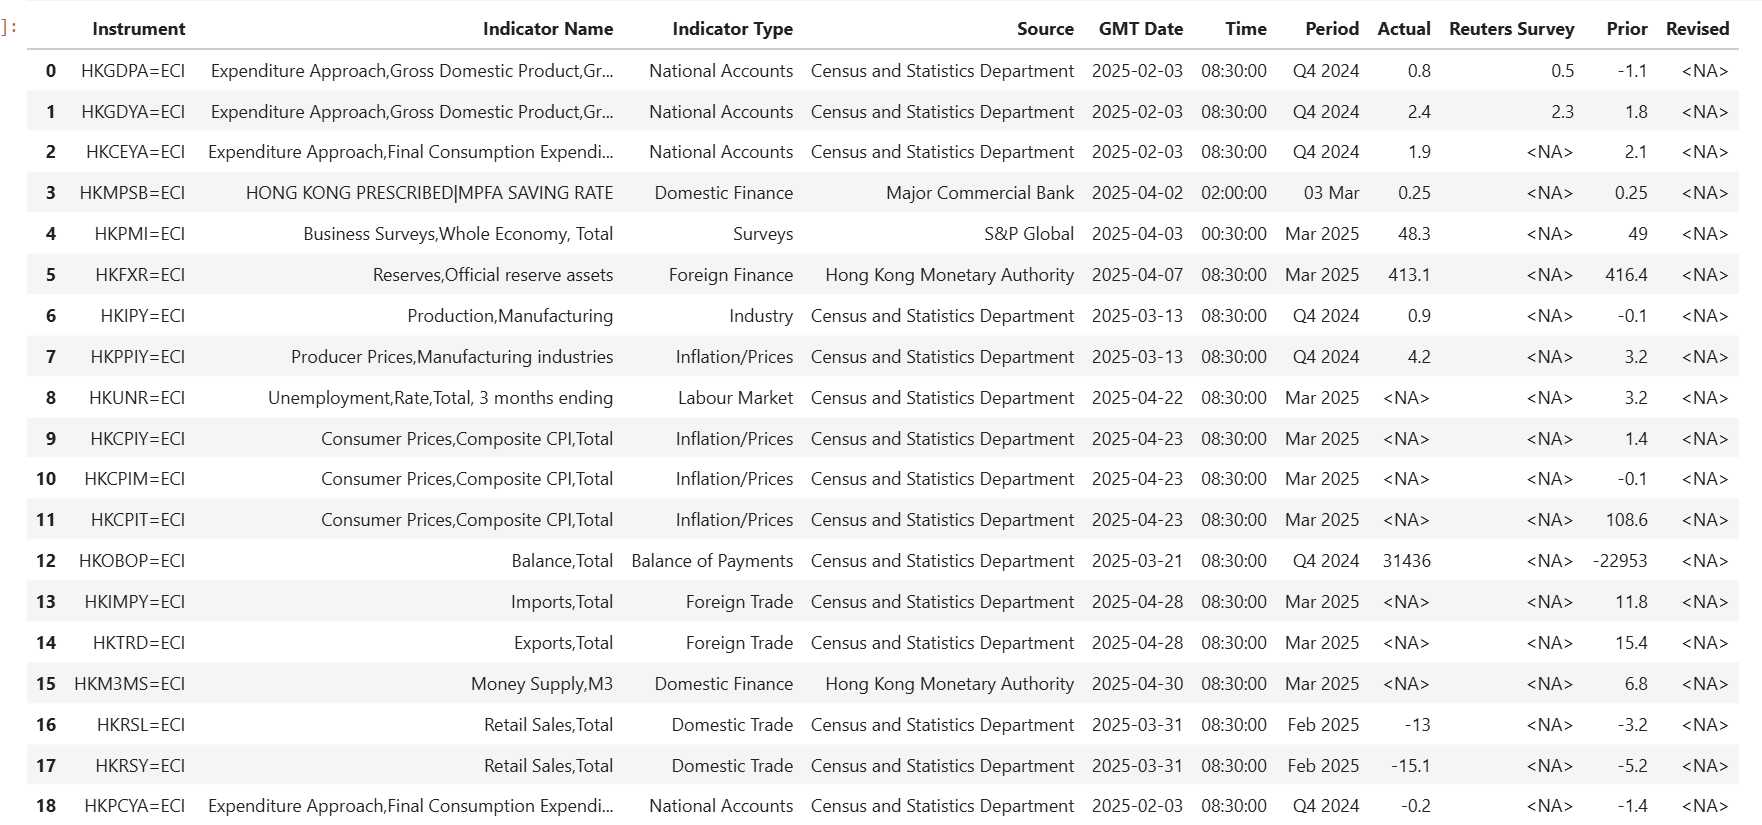
df
Here is the result in the df dataframe which contains the cross economic data:
References
You can find more detail regarding the Data Library and related technologies for this Notebook from the following resources:
- LSEG Data Library for Python on the LSEG Developer Community website.
- Data Library for Python - Reference Guide
- The Data Library for Python - Quick Reference Guide (Access layer) article.
- Essential Guide to the Data Libraries - Generations of Python library (EDAPI, RDP, RD, LD) article.
- Upgrade from using Eikon Data API to the Data library article.
- Data Library for Python Examples on GitHub repository.
- DN092084-Decommission of ECON chains from Workspace
For any question related to this example or Data Library, please use the Developers Community Q&A Forum.