

European Commission established the EU Taxonomy as part of its action plan on financing sustainable growth to achieve the Paris Agreement on climate change and the UN sustainable development goals. The EU Taxonomy, identifies sustainable economic activities into the six environmental objectives to encourage investment towards a green economy. It helps direct investments to the economic activities most needed for the transition, in line with the European Green Deal objectives. The taxonomy is a classification system that defines the criteria for economic activities that are aligned with a net zero trajectory by 2050 and the broader environmental goals other than climate.
The EU taxonomy is a sustainable finance framework and a market transparency tool. The green economy objectives are:
- Climate change mitigation
- Climate change adaptation
- Sustainable use and protection of water and marine resources
- Transition to a circular economy
- Pollution prevention and control
- Protection and restoration of biodiversity and ecosystems
To qualify as "environmentally sustainable" under the EU Taxonomy Regulation, an eligible activity must meet all these requirements.
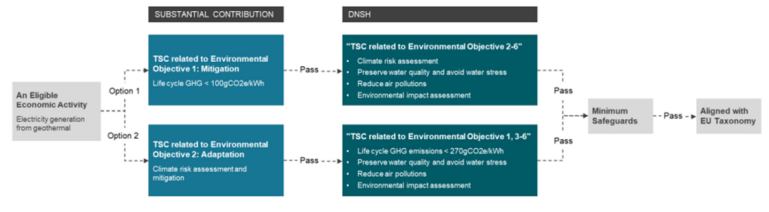
Example of electricity generation from geothermal energy
LSEG’s EU Taxonomy derived data solution aims to fill the reporting gap, by granularity estimating activity and company-level eligibility and alignment with Taxonomy objectives. This enables investors to report complete Taxonomy alignment alongside company reported data. The results from this derived approach are considered as estimates as they are not from direct company reporting or alignment (which is covered separately as reported data). The underlying data used for deriving EU Taxonomy, are estimates such as the FTSE Russell Green Revenues and Refinitiv ESG data, which relies on corporate disclosure.
The details of EU Taxonomy content collection and estimate methodology are described here.
Taxonomy data availability
Refinitiv provides the data related to ESG, Green Revenue and the EU Taxonomy through the bulk file downloads. These bulk files are available through the Client File Services (CFS) API within Refinitiv Data Platform (RDP) and allow a user to get a latest complete snapshot of all the data as well as any changes from the previous snapshot, which is updated weekly. The bulk files are delivered in the CSV and JSON format, which allows them to be used both within Excel, as well as within an application. This bulk data enables a quick analysis of a portfolio's alignment with the Taxonomy objectives.
Following files related to Taxonomy data are available within RDP bulk:
| Code | Description |
| Organization Classification | Organizations report financial information for a given financial period, and out of those figures, eligible and aligned amounts are determined based on specific criteria searched for, first within the Green Revenue data, and subsequently through the Fundamental data |
| Segment Classification | Total amounts reported by the organization are broken down by segments, and the total eligible amounts are stored for reporting purposes |
| Objective Classification | Each organization's reported data are tested against the EU Taxonomy technical screening criteria, either for substantial contributions, or "do no significant harm" criteria. Aligned amounts are stored for reporting purposes, and whether all technical screening criteria has passed |
| Passed Social Safeguard | For each Organization reporting, the Minimum Social Safeguards (MSS) which have been achieved for the given Fiscal Period are persisted |
| Activity | Contains a list of sustainable Activities which meet the specifications set out by the European Commission, to provide companies with a standardized sustainable finance reporting mechanism. The mapping of Activities to NACE (a classification system developed by the European Union) and Technical Screening Criteria specifies, for a given activity, thresholds which must be met based on certain measures reported. Technical Screening Criteria can be either "Substantial Contribution", "Do No Significant Harm Criteria", or "Minimum Social Safeguard" |
| Green Revenue Breakout | Provides Reported or estimated revenues from the micro sector (GRCS) |
| Segment Revenue Breakdown | Provides Reported or estimated revenues from the sector (TRBC) |
| Financial Segment | Contains information about financial segments for an organization |
| Financial Segment Values | Provides segment revenue reported by the company |
| Company Info | Provides reference information about the organization like Name, country of Domicile etc |
Structure of bulk files:
The files are available in two formats:
- JSONL: json line format, with the file extension .jsonl
- CSV: csv format with the file extension .csv
There are two updates types to these files:
- INIT: Full initialization file of all organizations
- DELTA: Refresh of organizations with changed data
All the files are compressed and delivered as a .gz file.
How to download and use EU-Tax data - code sample
The underlying mechanism of the Client File Store (CFS API) is to identify the file that is needed by your application (and you have permissions for). The step-by-step process to search for the files and get a download link is described in these tutorials. Although the tutorial is for Trade Discovery Data, same concepts are applicable to other CFS files as well.
Let us explore how a user can use CFS bulk Taxonomy files to generate a consolidated report for a portfolio. The working Jupyter notebook is provided in the code samples. The notebook takes following high level steps:
- Download the bulk files for Organization Classification and Minimum Social Safeguards, and save them as python pickle files for re-use
- Load the downloaded pickle files
- Read the portfolio to be analyzed. This is a CSV file with two columns - *RIC (identifier)" and *Weight"
- Find the Organization PermID and Reporting Currency for all the portfolio holdings using /data/symbology/Convert API. This ID is the key to reference a particular instrument in all future API calls.
- Merge the Classification data and Social Safeguards data into the portfolio
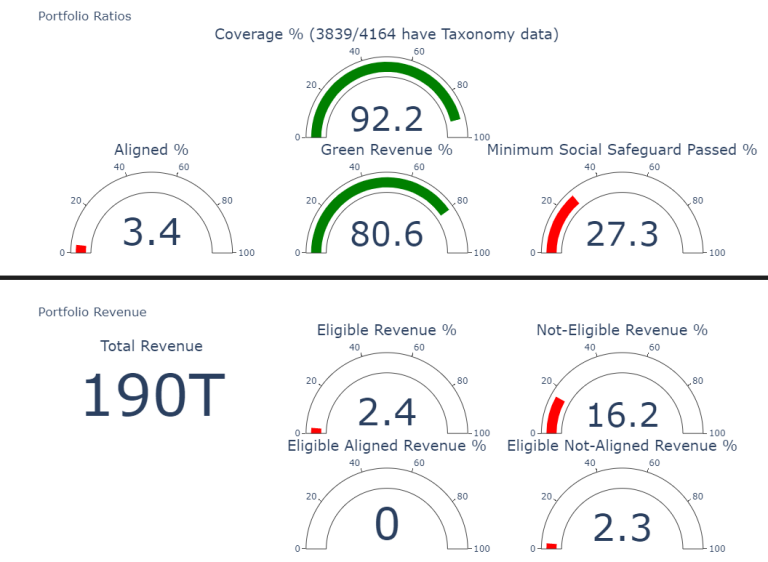
- Consolidate the numbers at portfolio level and draw charts. The output looks like this for FTSE All World Index:
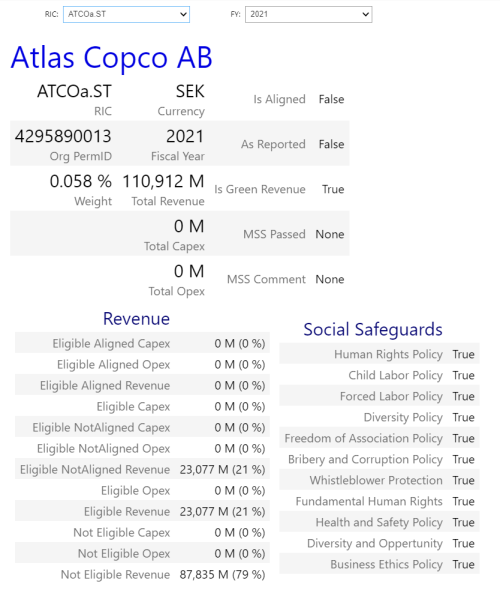
- Optionally a user can drill down and see taxonomy data for an individual holding:
Important: Since a portfolio can contain instruments in different currency, all the revenue amounts should be consolidated into a single currency - USD for example. This step is omitted in the sample workbook and left to the user.
Let us see the pertinent coding snippets to achieve these.
Download the bulk files
A function downloadJSONBulkFile takes bucket name and file attributes as parameters to search for, download and uncompresses the file. Since we are only interested in JSON files for use in this sample, so it is provided as an input filter. The CFS url is /file-store/v1/file-sets and all the taxonomy data is in the bucket Bulk-EuTax. We will download the data for OrganizationClassification and PassedSocialSafeguard which are passed as the content filter into the API call. Once the file is downloaded, each line of data is parsed as JSON object and the relevant fields are extracted and consolidated into a Pandas Dataframe.
def downloadJSONBulkFile(bucketName, fileAttributes, fileNameKeywords):
hResp = getRequest('/file-store/v1/file-sets?bucket=' + bucketName + '&pageSize=100&attributes=' + fileAttributes)
...
...
for l in jsonlFile.splitlines():
jObj = json.loads(l)
Load the target portfolio
The portfolio data is expected in a CSV file format and contains two columns - RIC and Weight. The weights should sum up to 100%. Once we have the portfolio, we can use the RDP symbology convert service to get the Organization PermID and the Reporting Currency, and add this data into the portfolio dataframe. The symbology service REST endpoint is /data/symbology/beta1/convert. This service limits the number of instruments that can be converted in a single call - hence a bigger list of instruments is divided into chunks of 100 each.
portfolio = pd.read_csv('Portfolio.csv')
RIClist = portfolio['RIC'].tolist()
bucketSize = 90
buckets = [ RIClist[i: i + bucketSize] for i in range(0, len(RIClist), bucketSize) ]
for bucket in buckets:
reqData = {
"universe": bucket,
"to": ["OrganizationId"]
}
hResp = postRequest('/data/symbology/beta1/convert', reqData)
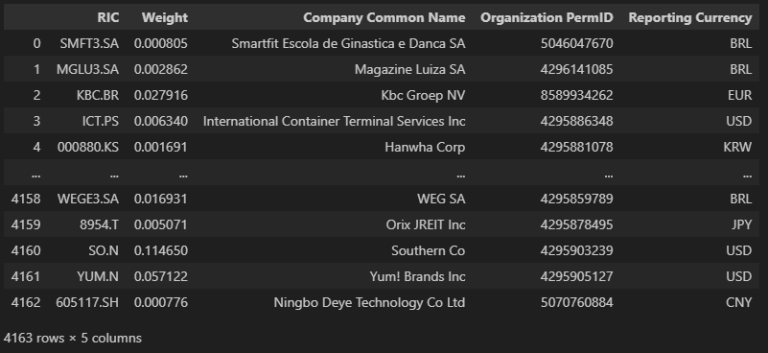
The final dataframe containing currency and organization data can now be merged into the original portfolio, and the result is (FTSE All World Index):
Merge Taxonomy data into portfolio
As a last step, we can now merge the EU Taxonomy data from Organization Classification and Minimum Social Safeguards data into the portfolio using the Pandas Dataframe merge operation. To consolidate the taxonomy numbers at portfolio level, we can simply multiply the weight of individual holding with the corresponding revenue amount and sum them up. There is an issue with this approach however - a portfolio can contains instruments which have different reporting currencies. So, for consolidated numbers to be accurate, all the currencies should be converted to a single currency and the revenue amounts should be scaled using this conversion amount. This step is not implemented in the code sample for this article, and readers can use RDP Historical Pricing service at endpoint /data/historical-pricing/v1/views/interday-summaries to get the currency cross rate for a particular date.
For example to rebase all the currencies to USD, use this code snippet:
# Rebase all the currencies in the portfolio to USD
currs = df1['Reporting Currency'].dropna().unique()
currRICs = ['{}='.format(x) for x in currs]
reqData = {
"universe": currRICs,
"end": "{0:.0f}-12-01".format(latestFYear),
"fields": ["MID_PRICE"]
}
hResp = postRequest('/data/historical-pricing/v1/views/interday-summaries', reqData)
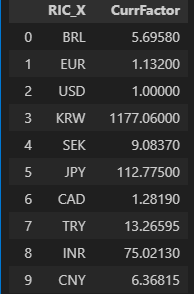
# create a dataframe with all the currency cross rates
cfactor = [(x['universe']['ric'][:-1], x['data'][0][1]) for x in hResp]
currencies = pd.DataFrame(cfactor, columns =['RIC_X', 'CurrFactor'])
This will produce a dataframe of all cross rates:
Finally we can use the Plotly graph objects to draw the charts from this consolidated portfolio data and ipywidgets to drill down into the individual holdings interactively.
See the sample Python notebook linked with this article for the complete working example.