
-
 Mihai TomaSenior Model Owner • Connected Markets & SFI
 -
 Raksina SamasiriDeveloper Advocate
How to retrieve the data, migrate existing ESG models and assess the portfolio impact of moving from legacy to the new LSEG ESG Scores.
Introduction
If you use legacy LSEG ESG Scores in investment models today, moving to the new framework is more than changing a data field. The methodology, scoring architecture and available analytical dimensions have changed, creating both implementation considerations and new opportunities for ESG analysis.
This guide takes an asset manager through the migration journey: from retrieving legacy and new scores and mapping the new architecture, to assessing the impact on an existing portfolio and determining how the new framework can be incorporated into investment workflows.
What you will achieve
By the end of this tutorial, you will be able to:
- Retrieve legacy and new LSEG ESG Scores for an investment portfolio.
- Map legacy ESG measures to the new Overall, Pillar and Theme architecture.
- Build a clean dataset for comparing the two methodologies.
- Assess changes in score distributions, rankings and portfolio-level exposures.
- Identify companies most affected by the methodology transition and investigate the drivers.
- Use Themes, materiality and ESG Scores Plus to enhance existing ESG models.
- Evaluate whether existing investment rules and thresholds need to be recalibrated.
Important: The new LSEG ESG Scores are not a rescaled version of the legacy scores. The new framework introduces a redesigned methodology, scoring scale, materiality assessment, indicator structure and additional risk and impact dimensions. Migration should therefore be treated as a model transition, not a numerical conversion.
| For ESG asset managers: the new framework offers a performance-based and a more structured assessment of management quality, measurable performance, materiality, risk and impact of ESG-corporate measures. This page introduces the score architecture and the portfolio analysis that can be built once the data is retrieved. |
This article focuses on the practical aspects of migrating from legacy ESG Scores to the new LSEG ESG Scores framework. While the migration concepts presented here are applicable regardless of how the data is accessed, the implementation examples use the LSEG Data Library for Python to demonstrate portfolio-level analysis and migration workflows.
To follow along with the examples, you will need Python 3.10 or later, access to LSEG Workspace, and the LSEG Data Library for Python. Additional setup instructions are provided in the Prerequisites section below.
Prerequisites
To follow along with this article, you will need:
- LSEG Workspace installed and running
- Access to ESG content through your LSEG subscription
- Python 3.10 or later with these libraries installed
- lseg-data==2.1.1 (LSEG Data Library for Python)
- pandas==2.3.3
- matplotlib==3.10.9
- ipykernel==7.2.0
1 ) What is changing with the new LSEG ESG Scores?
The new LSEG ESG Scores provide a rules-based assessment of how companies manage material environmental, social and governance risks and impacts. The framework translates publicly available company disclosures into comparable Theme, Pillar and Overall ESG Scores on a 0–5 scale, with materiality reflecting the company’s business activities.
For asset managers, the transition creates a more decision-oriented dataset: it combines disclosure, measurable outcomes and business-specific materiality, while ESG Scores Plus adds external risk and impact signals that can help differentiate companies with similar core ESG profiles.
| Existing workflow | New framework | Migration consideration |
|---|---|---|
Legacy Overall ESG Score |
Overall ESG Score |
Review score distributions and recalibrate existing thresholds rather than translating them directly |
Environmental / Social / Governance scores |
E / S / G Pillar Scores |
Assess changes in Pillar methodology, materiality and portfolio exposures |
10 Categories |
12 ESG Themes |
Map existing category-level models to the new Theme architecture rather than assuming one-to-one equivalence |
TRBC materiality approach |
Business-specific materiality |
Account for new Theme weights and significant revenue segments |
Combined / controversy-adjusted measures |
ESG Scores Plus |
Decide whether Risk, Impact or Complete provides the appropriate additional lens. Controversies has been enhanced and it’s part of the Risk score |
Individual ESG datapoints |
Indicators and underlying ESG data |
Review field definitions and determine which inputs remain appropriate for custom models |
Table 1. Migration map from Legacy D&A ESG scores to the new LSEG ESG scores. Note: this is not a methodological equivalence map. ESG scores, pillar scores should not be mapped identically 1:1. In addition, Legacy Categories and new Themes should not be treated as direct replacements.
2) Understanding the new LSEG ESG score architecture
2.1 ) Overall, Pillar and Theme Scores
The framework contains 12 Themes, aggregated into Environmental, Social and Governance Pillars and ultimately an Overall ESG Score.
| Pillar | Themes |
| Environmental | Climate Transition; Energy & Resource Use; Biodiversity; Water Use; Waste & Pollution |
| Social | Labour Relations; Health & Safety; Human Rights & Community |
| Governance | Board & Management; Shareholder Rights; Conduct & Anti-Corruption; Tax Transparency & Accounting |
2.2) Performance-based assessment
The framework combines several types of indicator assessment:
- Disclosure-based: Assess whether relevant policies, practices and metrics are reported.
- Absolute performance: Compares outcomes against predefined thresholds.
- Relative performance: Compare quantitative outcomes against Materiality Group peers.
- Capping metrics: Cap most Theme Scores at 3 unless critical requirements are met, helping prevent high scores based on disclosure alone and mitigate greenwashing risk.
2.3) Business-specific materiality
Materiality is linked to a company’s business activities rather than only its headline sector. Revenue segments representing more than 10% of total revenues can influence the materiality assessment, allowing diversified companies to be assessed against ESG issues relevant to significant parts of their business.
2.4) Data and methodology characteristics
- 222 scoring indicators selected from more than 900 company-level ESG data points.
- Publicly available company disclosures are used for the core ESG Score.
- Segment-driven materiality considers significant revenue segments representing more than 10% of company revenue.
- Scores are rule-based and deterministic; the score calculation does not use AI.
- Scores and underlying data are refreshed as new disclosures become available, with weekly recalculation.
3) LSEG ESG Scores Plus
LSEG ESG Scores Plus extends the core ESG Score with external risk and impact signals, providing a broader view of a company's sustainability footprint and business model.
- Green Revenues: Exposure to revenues from green products and services.
- Green / ESG Issuance: Exposure to sustainable or ESG-linked debt issuance.
- ESG Controversies: Relevant external controversy signals derived from news sources.
- Sovereign ESG Risk: ESG risk associated with the countries in which a company operates.
Three complementary lenses are available: Risk combines controversies and sovereign exposure; Impact combines green revenues and green issuance; Complete combines all four signals.
4) Which score should I use?
Investment need |
Data to consider |
Typical use |
Broad ESG integration |
Overall ESG Score |
Portfolio scoring, security selection and monitoring |
Environmental, social or governance analysis |
Pillar Scores |
E/S/G attribution and portfolio exposure |
Specific sustainability objectives |
Theme Scores |
Climate, biodiversity, human rights, governance or customised ESG models |
Understanding company-specific materiality |
Theme materiality |
Interpreting scores and constructing materiality-aware models |
External ESG risk |
ESG Scores Plus – Risk |
Controversy and sovereign-risk overlays |
Positive sustainability contribution |
ESG Scores Plus – Impact |
Green activity and financing analysis |
Combined sustainability view |
ESG Scores Plus – Complete |
Combining core ESG, risk and impact |
Custom ESG models |
Indicators / underlying data |
Building proprietary signals and investment rules |
Exclusions and screens |
Relevant underlying datasets, including controversies/product involvement where applicable |
Values-based or activity-based screening |
5) Build the migration dataset
The API journey should form the core of the implementation.. The next step is to retrieve the relevant ESG fields through LSEG data services and bring them into the asset manager’s analytical workflow.
Preparation Step
Start with importing necessary libraries and open session.
import lseg.data as ld
import pandas as pd
import matplotlib.pyplot as plt
from lseg.data.discovery import Chain
# Silences a pandas FutureWarning raised inside lseg-data
pd.set_option("future.no_silent_downcasting", True)
ld.open_session()
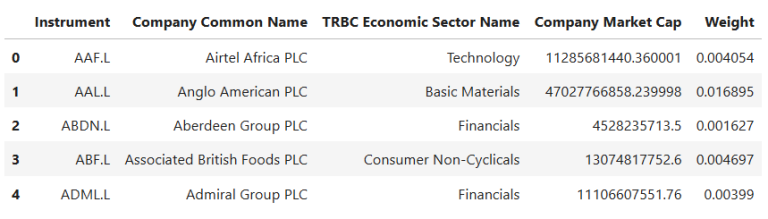
5.1 ) Define the portfolio
Start with the portfolio universe, including security identifiers and, where relevant, portfolio weights.
Here is how we define the portfolio
universe = Chain(name="0#.FTSE").constituents
portfolio = ld.get_data(universe, ["TR.CommonName", "TR.TRBCEconomicSector", "TR.CompanyMarketCap"])
portfolio["Weight"] = portfolio["Company Market Cap"] / portfolio["Company Market Cap"].sum()
portfolio.head()
5.2) Retrieve legacy ESG Scores
Retrieve the ESG fields currently used in the investment process. This establishes the baseline against which the migration will be assessed.
Here is how we retrieve the legacy data
legacy = ld.get_data(
universe,
[
"TR.TRESGScore",
"TR.TRESGScore.date",
"TR.TRESGCScore",
"TR.TRESGCControversiesScore",
"TR.EnvironmentPillarScore",
"TR.SocialPillarScore",
"TR.GovernancePillarScore",
],
)
legacy.head()

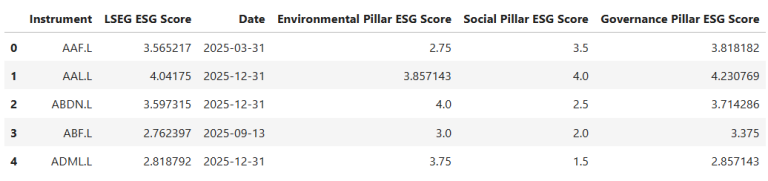
5.3) Retrieve new Overall and Pillar Scores
Retrieve the new Overall ESG Score together with Environmental, Social and Governance Pillar Scores.
Here is how we retrieve the new scores
new = ld.get_data(
universe,
[
"TR.ESGScore",
"TR.ESGScore.date",
"TR.EnvironmentalPillarESGScore",
"TR.SocialPillarESGScore",
"TR.GovernancePillarESGScore",
],
)
new.head()
5.4) Retrieve Themes and materiality
Add Theme Scores and relevant materiality information. These fields become particularly important when investigating companies whose assessment changes materially.
Here is how we retrieve Themes and materiality
theme_fields = [] # e.g. Theme Score and Theme materiality field codes
if theme_fields:
themes = ld.get_data(universe, theme_fields)
display(themes.head())
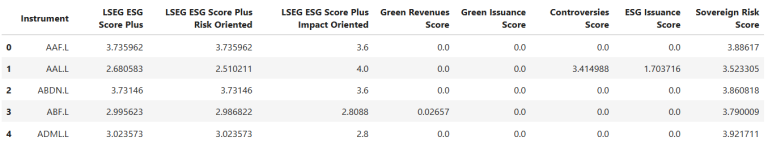
5.5) Retrieve ESG Scores Plus
Add the Risk, Impact and/or Complete dimensions required by the investment strategy.
Here is how we retrieve ESG Scores Plus
plus = ld.get_data(
universe,
[
"TR.ESGPlusCompleteScore",
"TR.ESGPlusRiskScore",
"TR.ESGPlusImpactScore",
"TR.GreenRevenuesScore",
"TR.GreenIssuanceScore",
"TR.ControversiesScore",
"TR.ESGIssuanceScore",
"TR.SovereignRiskScore",
],
)
plus.head()
5.6) Join and prepare the migration dataset
Bring legacy and new measures into a common issuer-level dataset ready for portfolio analysis.
Implementation should consider:
- Missing observations and differences in coverage.
- Score fiscal year, date and status.
- Differences in historical availability.
- Multiple securities belonging to the same issuer.
- Portfolio weights and aggregation methodology.
- Currency or identifier consistency where relevant.
- Whether comparisons use the same company universe and observation period.
The new LSEG ESG Scores are available from FY2022 onwards, and scores may be flagged as indicative while disclosures are still being completed. Scores are refreshed weekly as new information becomes available.
Here is how we create the clean migration dataset
data = (
portfolio
.merge(legacy, on="Instrument")
.merge(new, on="Instrument", suffixes=(" (legacy)", " (new)"))
.merge(plus, on="Instrument")
)
legacy_scores = ["ESG Score", "ESG Combined Score", "ESG Controversies Score",
"Environmental Pillar Score", "Social Pillar Score", "Governance Pillar Score"]
new_scores = ["LSEG ESG Score", "Environmental Pillar ESG Score", "Social Pillar ESG Score", "Governance Pillar ESG Score"]
plus_scores = ["LSEG ESG Score Plus", "LSEG ESG Score Plus Risk Oriented", "LSEG ESG Score Plus Impact Oriented",
"Green Revenues Score", "Green Issuance Score", "Controversies Score", "ESG Issuance Score", "Sovereign Risk Score"]
score_columns = legacy_scores + new_scores + plus_scores
data[score_columns] = data[score_columns].apply(pd.to_numeric, errors="coerce")
# Coverage: share of companies with a value for each field
data.notna().mean().round(2)
# ('data.notna().mean()') shows, for each field, the share of companies (0 to 1) that have a value. A field close to 1.0 has good coverage across the portfolio; a low value means many companies are missing that score and results based on it will rely on fewer holdings.
#Next we check whether the legacy and new scores refer to comparable periods.
# Score years: check both methodologies refer to comparable periods
legacy_year = pd.to_datetime(data["Date (legacy)"]).dt.year
new_year = pd.to_datetime(data["Date (new)"]).dt.year
pd.crosstab(legacy_year, new_year, rownames=["Legacy score year"], colnames=["New score year"])
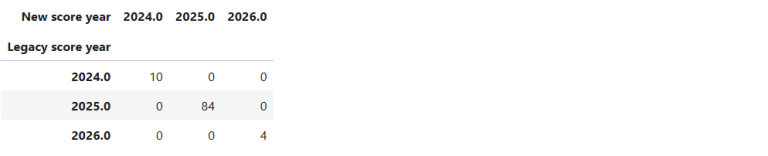
The crosstab above is a matrix: rows are the legacy score year, columns are the new score year, and each cell counts the companies with that combination. Most companies should sit on the diagonal (same year for both scores); many off-diagonal companies would mean the two scores are not always comparable period-for-period.
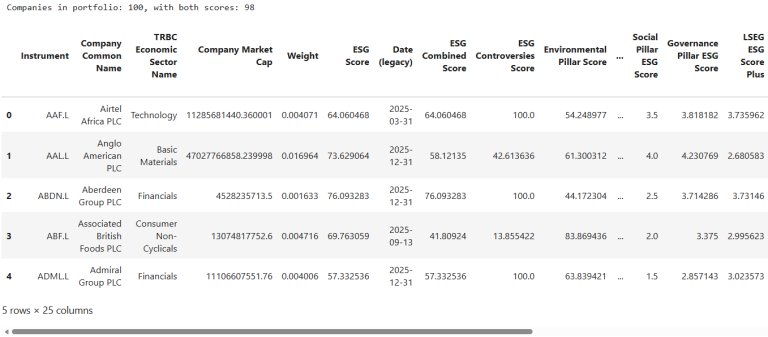
We now keep only the companies that have both a legacy and a new Overall ESG Score, and rescale their weights so they sum back to 1 within this smaller set.
df = data.dropna(subset=["ESG Score", "LSEG ESG Score"]).copy()
df["Weight"] = df["Weight"] / df["Weight"].sum()
print(f"Companies in portfolio: {len(data)}, with both scores: {len(df)}")
df.head()
6) Run a portfolio migration diagnostic
Once the migration dataset is built, the objective is not simply to compare two averages. The analysis should identify what changed, where it changed and why.
Using a portfolio of approximately 100 companies, the diagnostic could include:
6.1 ) Compare portfolio distributions
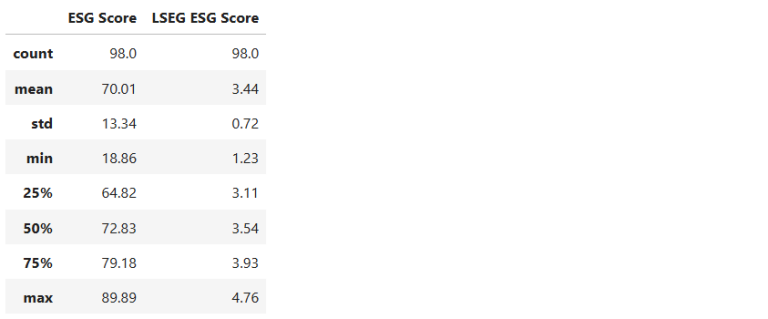
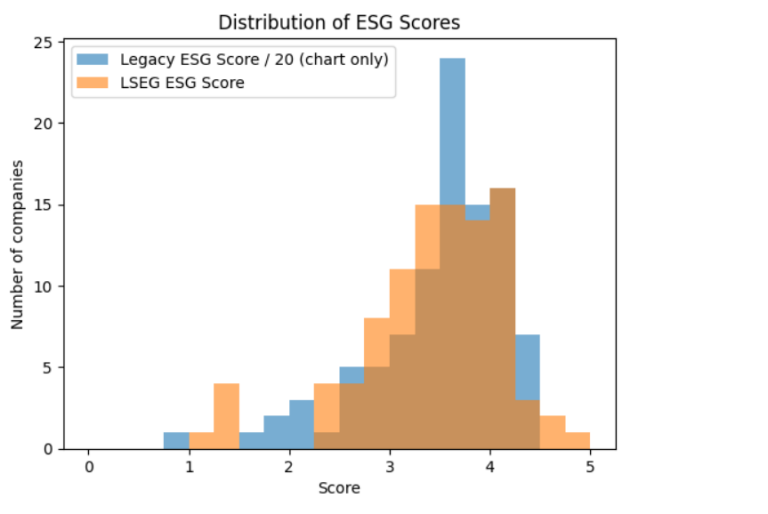
Compare the distribution of legacy and new ESG Scores across the same holdings. For visualisation only, legacy scores may be divided by 20 to display a 0–100 legacy score alongside a 0–5 new score on a common chart scale. This is a visualisation technique only. Dividing a legacy score by 20 does not convert it into a new ESG Score or make the two methodologies equivalent.
Here is how we compare score distributions
df[["ESG Score", "LSEG ESG Score"]].describe().round(2)
plt.hist(df["ESG Score"] / 20, bins=20, range=(0, 5), alpha=0.6, label="Legacy ESG Score / 20 (chart only)")
plt.hist(df["LSEG ESG Score"], bins=20, range=(0, 5), alpha=0.6, label="LSEG ESG Score")
plt.title("Distribution of ESG Scores")
plt.xlabel("Score")
plt.ylabel("Number of companies")
plt.legend()
plt.show()
6.2) Measure ranking changes
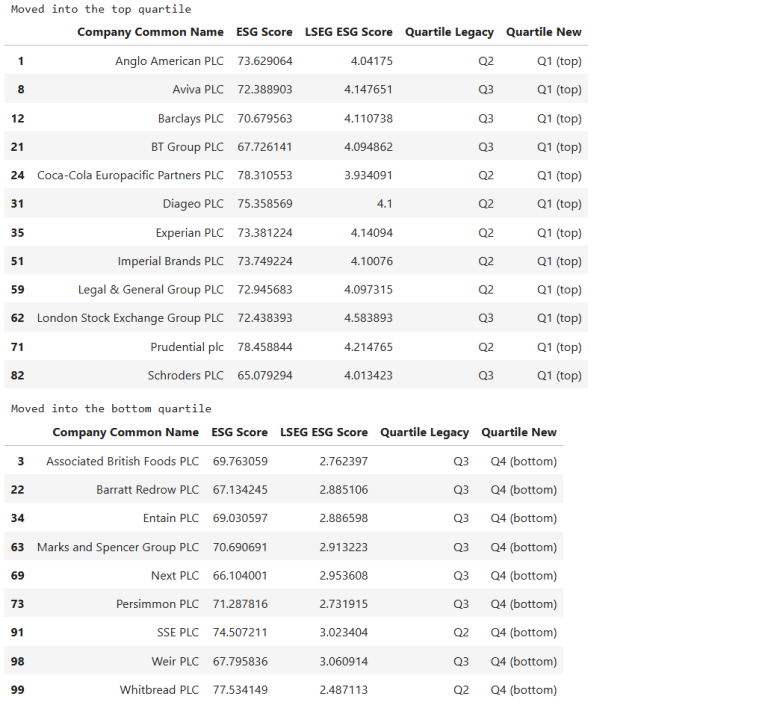
Analyse whether companies retain similar relative positions under the two methodologies. Useful diagnostics can include correlation, rank correlation, quartiles and changes in portfolio ranking. Highlight companies moving into or out of the top and bottom quartiles. Here is how we analyse rank changes and correlation between scores.
print("Correlation:", round(df["ESG Score"].corr(df["LSEG ESG Score"]), 2))
print("Rank correlation:", round(df["ESG Score"].corr(df["LSEG ESG Score"], method="spearman"), 2))
# Percentile rank: 0 = lowest score in the portfolio, 1 = highest
df["Rank Legacy"] = df["ESG Score"].rank(pct=True)
df["Rank New"] = df["LSEG ESG Score"].rank(pct=True)
df["Rank Change"] = df["Rank New"] - df["Rank Legacy"]
quartiles = ["Q4 (bottom)", "Q3", "Q2", "Q1 (top)"]
df["Quartile Legacy"] = pd.qcut(df["ESG Score"].rank(method="first"), 4, labels=quartiles)
df["Quartile New"] = pd.qcut(df["LSEG ESG Score"].rank(method="first"), 4, labels=quartiles)
pd.crosstab(df["Quartile Legacy"], df["Quartile New"])
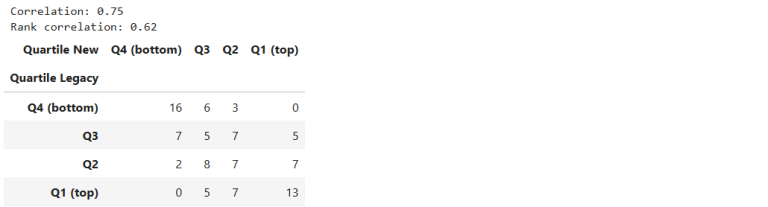
The crosstab above is a matrix: rows are the legacy quartile, columns are the new quartile, and each cell is the number of companies in that combination. Numbers on the diagonal are companies that stayed in the same quartile; numbers off the diagonal moved quartile after the transition.
Next, we list the companies that moved into or out of the top and bottom quartiles.
columns = ["Company Common Name", "ESG Score", "LSEG ESG Score", "Quartile Legacy", "Quartile New"]
print("Moved into the top quartile")
display(df[(df["Quartile New"] == "Q1 (top)") & (df["Quartile Legacy"] != "Q1 (top)")][columns])
print("Moved into the bottom quartile")
display(df[(df["Quartile New"] == "Q4 (bottom)") & (df["Quartile Legacy"] != "Q4 (bottom)")][columns])
6.3) Identify the largest movers
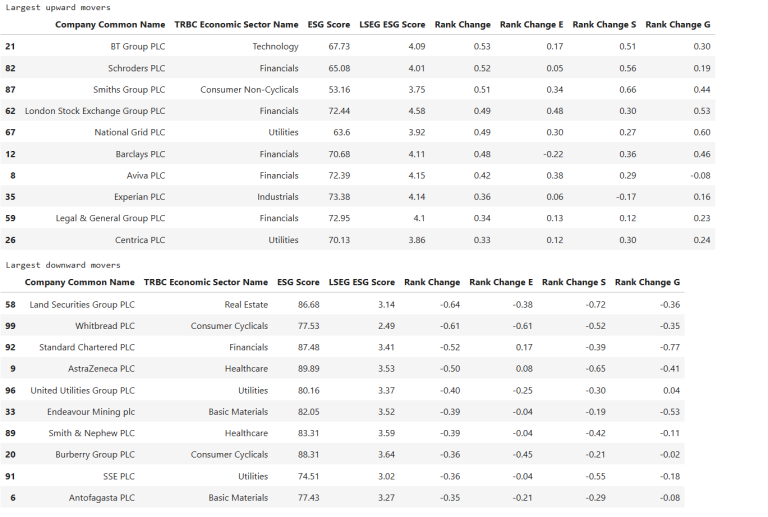
Identify holdings with the largest differences between their legacy and new assessments. For these companies, drill down from:
Overall Score → Pillar → Theme → indicator → underlying data
This helps determine whether the change is associated with measurable performance, materiality, a specific sustainability Theme or another methodological difference.
Here is how we identify and explain the largest movers
pillars = {
"E": ("Environmental Pillar Score", "Environmental Pillar ESG Score"),
"S": ("Social Pillar Score", "Social Pillar ESG Score"),
"G": ("Governance Pillar Score", "Governance Pillar ESG Score"),
}
for pillar, (legacy_column, new_column) in pillars.items():
df[f"Rank Change {pillar}"] = df[new_column].rank(pct=True) - df[legacy_column].rank(pct=True)
columns = ["Company Common Name", "TRBC Economic Sector Name", "ESG Score", "LSEG ESG Score",
"Rank Change", "Rank Change E", "Rank Change S", "Rank Change G"]
print("Largest upward movers")
display(df.nlargest(10, "Rank Change")[columns].round(2))
print("Largest downward movers")
display(df.nsmallest(10, "Rank Change")[columns].round(2))
6.4) Identify companies crossing investment thresholds
This is particularly important when using ESG Scores directly in investment rules.
Suppose an existing strategy excludes companies with a legacy ESG Score below 30. The equivalent rule should not automatically become a new ESG Score below 1.5.
Instead:
- Apply the existing rule to the legacy portfolio.
- Analyse the distribution of the new ESG Scores for the same universe.
- Identify holdings whose eligibility changes.
- Investigate the Pillar, Theme and materiality drivers for those changes.
- Evaluate alternative thresholds against the strategy’s investment objective.
- Recalibrate and document the new rule before implementation.
Here is how we test existing portfolio thresholds
LEGACY_THRESHOLD = 30
df["Excluded Legacy"] = df["ESG Score"] < LEGACY_THRESHOLD
print(f"Legacy rule excludes {df['Excluded Legacy'].sum()} companies")
# New-score threshold that excludes the same number of companies
same_count_threshold = df["LSEG ESG Score"].quantile(df["Excluded Legacy"].mean())
print(f"New-score threshold with the same exclusion rate: {same_count_threshold:.2f}")
# Output
Legacy rule excludes 1 companies New-score threshold with the same exclusion rate: 1.38
results = []
for threshold in [1.0, 1.5, 2.0, 2.5, 3.0, round(same_count_threshold, 2)]:
excluded_new = df["LSEG ESG Score"] < threshold
results.append({
"New threshold": threshold,
"Excluded": excluded_new.sum(),
"Weight excluded": df.loc[excluded_new, "Weight"].sum().round(3),
"Newly excluded": (excluded_new & ~df["Excluded Legacy"]).sum(),
"Newly eligible": (~excluded_new & df["Excluded Legacy"]).sum(),
})
pd.DataFrame(results)
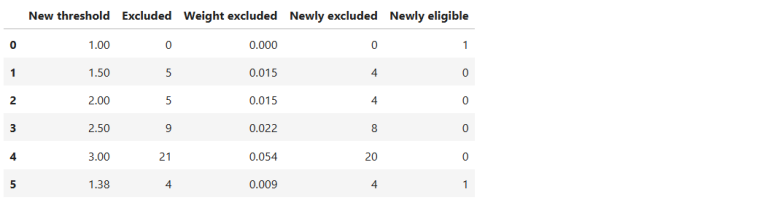
The table above compares candidate thresholds on the new score. For each one: Excluded and Weight excluded show how strict the rule would be; Newly excluded are companies that pass the legacy rule but would be excluded under the new one; Newly eligible are companies excluded today that would pass under the new rule. Use this to pick a threshold, rather than assuming 30 / 20 = 1.5.
# Pick a threshold after reviewing the table above, then list the companies whose eligibility changes
NEW_THRESHOLD = 1.5
df["Excluded New"] = df["LSEG ESG Score"] < NEW_THRESHOLD
changed = df[df["Excluded Legacy"] != df["Excluded New"]]
changed[["Company Common Name", "TRBC Economic Sector Name", "ESG Score", "LSEG ESG Score",
"Excluded Legacy", "Excluded New", "Rank Change E", "Rank Change S", "Rank Change G"]].round(2)

6.5) Assess portfolio and sector impacts
Move beyond company-level changes to assess whether the migration systematically changes:
- Weighted-average portfolio ESG characteristics.
- Sector and industry exposures.
- Top and bottom ESG exposures.
- Portfolio concentration.
- Exclusions or investable universe.
- Risk and impact characteristics.
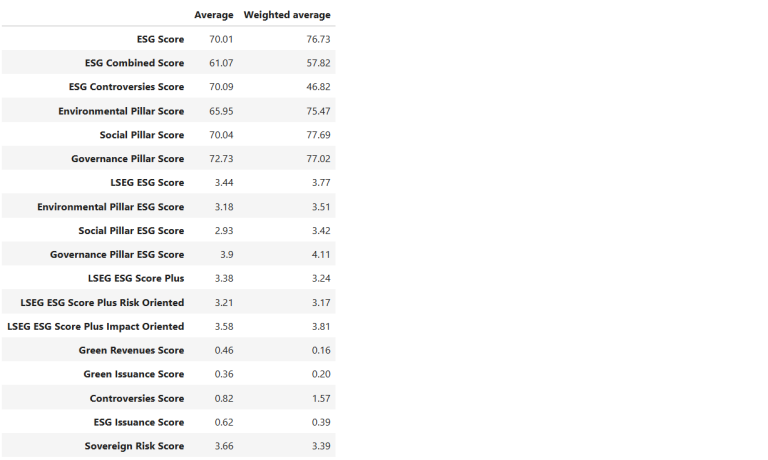
Here is how we measure the portfolio impact
def weighted_average(data, column):
valid = data.dropna(subset=[column])
return (valid[column] * valid["Weight"]).sum() / valid["Weight"].sum()
pd.DataFrame({
"Average": df[score_columns].mean(),
"Weighted average": [weighted_average(df, c) for c in score_columns],
}).round(2)
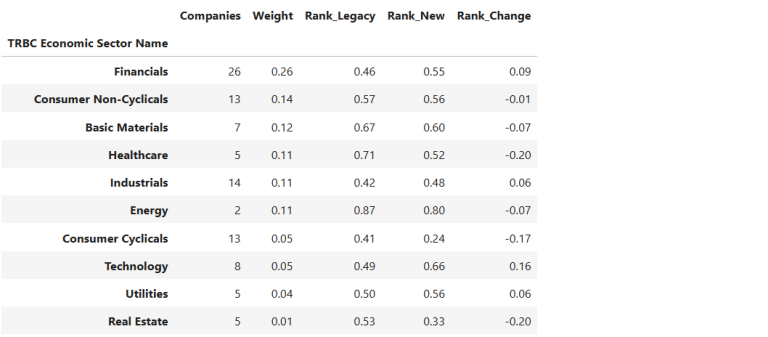
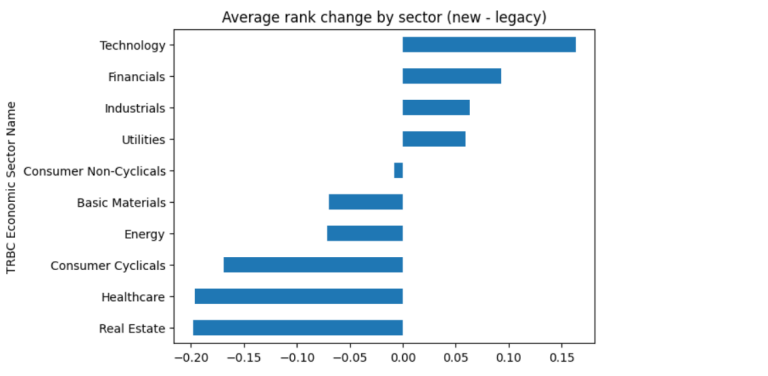
Now the same comparison broken down by sector: number of companies, portfolio weight, and average percentile rank under the legacy and new scores. Rank_Change is positive for sectors that moved up in relative ranking after the transition, negative for sectors that moved down.
sectors = df.groupby("TRBC Economic Sector Name").agg(
Companies=("Company Common Name", "count"),
Weight=("Weight", "sum"),
Rank_Legacy=("Rank Legacy", "mean"),
Rank_New=("Rank New", "mean"),
)
sectors["Rank_Change"] = sectors["Rank_New"] - sectors["Rank_Legacy"]
sectors.sort_values("Weight", ascending=False).round(2)
sectors["Rank_Change"].sort_values().plot.barh(title="Average rank change by sector (new - legacy)")
plt.show()
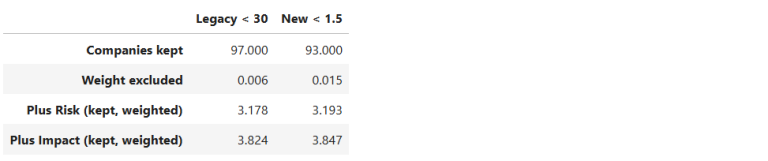
Finally, we compare the two exclusion rules from section 5.4 on the whole portfolio: how many companies each rule keeps, how much portfolio weight it excludes, and the weighted ESG Scores Plus Risk and Impact of the companies that remain.
# Impact of each exclusion rule on the investable universe
risk, impact = "LSEG ESG Score Plus Risk Oriented", "LSEG ESG Score Plus Impact Oriented"
pd.DataFrame({
f"Legacy < {LEGACY_THRESHOLD}": {
"Companies kept": (~df["Excluded Legacy"]).sum(),
"Weight excluded": df.loc[df["Excluded Legacy"], "Weight"].sum(),
"Plus Risk (kept, weighted)": weighted_average(df[~df["Excluded Legacy"]], risk),
"Plus Impact (kept, weighted)": weighted_average(df[~df["Excluded Legacy"]], impact),
},
f"New < {NEW_THRESHOLD}": {
"Companies kept": (~df["Excluded New"]).sum(),
"Weight excluded": df.loc[df["Excluded New"], "Weight"].sum(),
"Plus Risk (kept, weighted)": weighted_average(df[~df["Excluded New"]], risk),
"Plus Impact (kept, weighted)": weighted_average(df[~df["Excluded New"]], impact),
},
}).round(3)
7) Explain a score change: worked company example
For one material portfolio mover, the tutorial should demonstrate the full analytical journey.
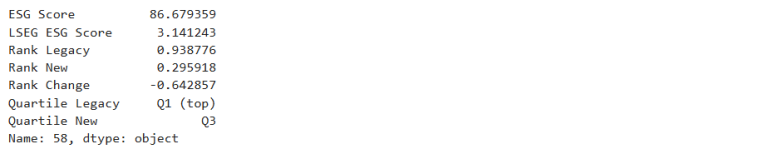
We pick the company with the largest rank change.
company = df.loc[df["Rank Change"].abs().idxmax()]
print(company["Company Common Name"], "-", company["TRBC Economic Sector Name"])
# Output
# Land Securities Group PLC - Real Estate
7.1 ) Start with the Overall ESG Score
Compare the company’s legacy assessment with its new Overall Score and establish the magnitude of the change.
company[["ESG Score", "LSEG ESG Score", "Rank Legacy", "Rank New", "Rank Change", "Quartile Legacy", "Quartile New"]]
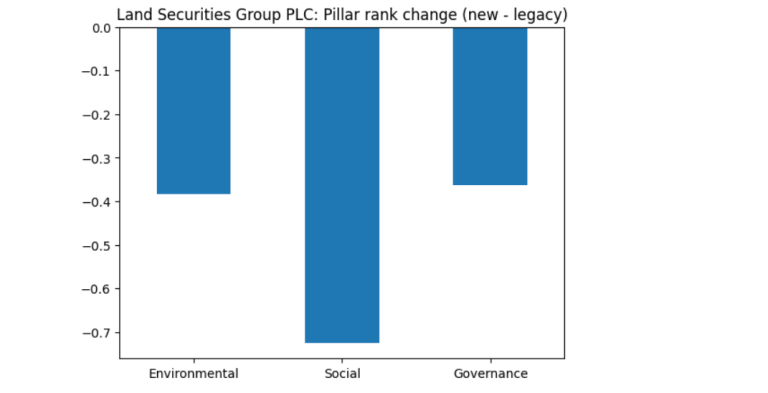
7.2) Move to the Pillars
Identify whether Environmental, Social or Governance contributes most strongly to the new assessment.
pillar_view = pd.DataFrame({
"Legacy score": [company[legacy_column] for legacy_column, _ in pillars.values()],
"New score": [company[new_column] for _, new_column in pillars.values()],
"Rank change": [company[f"Rank Change {p}"] for p in pillars],
}, index=["Environmental", "Social", "Governance"])
pillar_view.round(2)

pillar_view["Rank change"].plot.bar(title=f"{company['Company Common Name']}: Pillar rank change (new - legacy)", rot=0)
plt.axhline(0, color="grey")
plt.show()
7.3) Drill into Themes
Determine which of the 12 Themes explain the Pillar result and examine their materiality to the company’s business model.
7.4) Inspect indicators and underlying data
For the most important Theme, identify the disclosure, absolute-performance, relative-performance and/or capping indicators influencing the assessment.
drilldown_fields = [] # e.g. Theme Scores, Theme materiality and indicator field codes
if drilldown_fields:
display(ld.get_data(company["Instrument"], drilldown_fields).T)
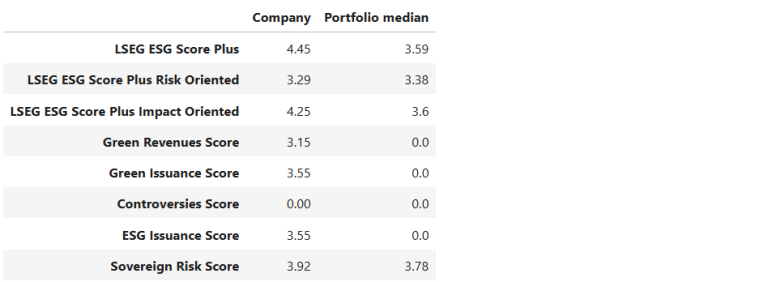
7.5) Add ESG Scores Plus
Finally, assess whether external Risk or Impact signals change the view of the company.
This provides a transparent path from a portfolio-level signal to the underlying sustainability information:
Portfolio → Company → Overall → Pillar → Theme → Indicator → Data → Risk / Impact
pd.DataFrame({
"Company": company[plus_scores].astype(float),
"Portfolio median": df[plus_scores].median(),
}).round(2)
8) Use migration to improve the investment model
Migration does not have to mean replacing one ESG variable with another. The new architecture can support different levels of integration.
8.1 ) Simple ESG integration
Use Overall and Pillar Scores to maintain a relatively simple ESG input while gaining clearer E/S/G attribution.
Portfolio → Overall ESG Score → E/S/G Pillars
8.2) Custom sustainability strategy
Use Themes and underlying indicators to construct an investment signal aligned with the strategy’s specific sustainability objectives. For example, a strategy could place greater emphasis on Climate Transition, Biodiversity and Human Rights rather than relying solely on an aggregated ESG score.
8.3) Separate management quality, risk and impact
Use the core ESG Score as the assessment of company ESG management, then add Risk and Impact as distinct overlays through ESG Scores Plus. This allows different sustainability dimensions to remain visible rather than being collapsed into a single signal
9) Practical migration checklist
Before moving an investment process into production:
- Map every legacy ESG field currently used to its intended role in the new framework.
- Retrieve overlapping legacy and new data for a consistent investment universe.
- Review coverage, missing data, dates and historical availability.
- Compare score distributions and portfolio rankings.
- Identify the largest company-level movers.
- Investigate movers using Pillars, Themes, materiality, indicators and underlying data.
- Test existing exclusions, thresholds and portfolio rules.
- Recalibrate thresholds rather than translating legacy values mechanically.
- Assess portfolio, sector and investable-universe impacts.
- Decide whether Themes or ESG Scores Plus can improve the existing investment model.
- Document methodology and model changes for governance purposes.
- Run legacy and new approaches in parallel, where appropriate, before production cutover.
Moving from score replacement to model migration
The transition to the new LSEG ESG Scores should therefore be treated as a model migration rather than a score conversion.
For asset managers, the opportunity is not only to reproduce an existing workflow using a new field. The redesigned architecture provides a more granular way to understand management quality, material sustainability issues, measurable performance, external ESG risk and positive impact, allowing clients to determine which dimensions are relevant to their investment strategy and how they should influence portfolio decisions.
The practical migration process therefore becomes:
retrieve → map → compare → diagnose → recalibrate → enhance → implement
Methodology reference: LSEG ESG Scores Methodology, July 2026.
Conclusion
Migrating to the new LSEG ESG Scores framework is more than a simple field replacement exercise. The introduction of business-specific materiality, enhanced performance measures, and ESG Scores Plus can lead to meaningful differences in how companies and portfolios are assessed. As a result, asset managers should take the opportunity to understand the drivers behind score changes rather than rely solely on direct comparisons with legacy scores.
By following a structured migration workflow, from retrieving legacy and new ESG datasets to analyzing score movements, materiality impacts, and portfolio-level effects, firms can gain greater transparency into the transition and make informed adjustments to their investment processes. The additional perspectives provided by ESG Scores Plus can further enrich sustainability assessments by incorporating risk and impact considerations alongside traditional ESG analysis.
Using Python and the LSEG Data Library, these migration and validation exercises can be integrated into existing portfolio analytics workflows, helping investment teams evaluate the implications of the new framework at scale. Ultimately, a well-planned migration enables asset managers to move beyond score mapping and towards a deeper understanding of the sustainability characteristics that influence portfolio allocation decisions.
- Register or Log in to applaud this article
- Let the author know how much this article helped you
If you require assistance, please
contact us here
Get In Touch

Source Code
Related APIs
Related Articles
Request Free Trial
Call your local sales team
Americas
All countries (toll free): +1 800 427 7570
Brazil: +55 11 47009629
Argentina: +54 11 53546700
Chile: +56 2 24838932
Mexico: +52 55 80005740
Colombia: +57 1 4419404
Europe, Middle East, Africa
Europe: +442045302020
Africa: +27 11 775 3188
Middle East & North Africa: 800035704182
Asia Pacific (Sub-Regional)
Australia & Pacific Islands: +612 8066 2494
China mainland: +86 10 6627 1095
Hong Kong & Macau: +852 3077 5499
India, Bangladesh, Nepal, Maldives & Sri Lanka:
+91 22 6180 7525
Indonesia: +622150960350
Japan: +813 6743 6515
Korea: +822 3478 4303
Malaysia & Brunei: +603 7 724 0502
New Zealand: +64 9913 6203
Philippines: 180 089 094 050 (Globe) or
180 014 410 639 (PLDT)
Singapore and all non-listed ASEAN Countries:
+65 6415 5484
Taiwan: +886 2 7734 4677
Thailand & Laos: +662 844 9576