
If you work in finance, the majority of your work probably happens online: You may periodically check an internal dashboard in your web browser or look at ticking prices in the Eikon terminal. Nevertheless, your boss may want you to send them a good old Excel factsheet at the end of each day.
Maybe that’s because it’s still more difficult to get internet access on a plane than opening an Excel file. Or maybe they like the fact that they can add their back-of-the-envelope calculations on the same sheet. Also, they can export it as a PDF and send it to a client. Whatever the reasons are, Excel factsheets remain highly popular.
Let’s see how we can automate hours of work by using Python with the open-source packages eikon and xlwings to create a financial factsheet.
Overview
- Prerequisites
- Getting started with Eikon and xlwings CE
- A first basic template
- Reporting with xlwings PRO
- A real world example
- Conclusion
Prerequisites
To follow this tutorial you will need the following:
- Access to an Eikon terminal. For more information about the Eikon Data API please go to the developer community site. To request a free trial for Eikon go here. If you have any questions about the Eikon Data API please use the monitored Q&A forum.
- A Python installation with the eikon, xlwings and pandas packages installed.
If you don’t have a local installation of Python yet, I’d recommend to install the Anaconda distribution as it comes with all the packages preinstalled with the exception of eikon. To fix this, run pip install eikon on a command prompt.
Getting started with Eikon and xlwings CE
To get a feeling about how xlwings and Eikon work hand in hand, save the following code as sample1.py, then run it with python sample1.py (you could also copy/paste this into a Jupyter notebook cell instead). Note that you will find all samples from this blog post on GitHub.
# sample1.py
import eikon as ek
import xlwings as xw
# Please read your Eikon APP_KEY from a config file or environment variable
ek.set_app_key('YOUR_APP_KEY')
# Parameters
instrument = '.DJI'
start_date = '2020-01-01'
end_date = '2020-01-31'
# Request time series data from Eikon, will return a Pandas DataFrame
df = ek.get_timeseries(instrument,
fields='*',
start_date=start_date,
end_date=end_date)
# Open a new Excel workbook and write the Pandas DataFrame to A1 on the first sheet
wb = xw.Book()
wb.sheets[0]['A1'].value = df
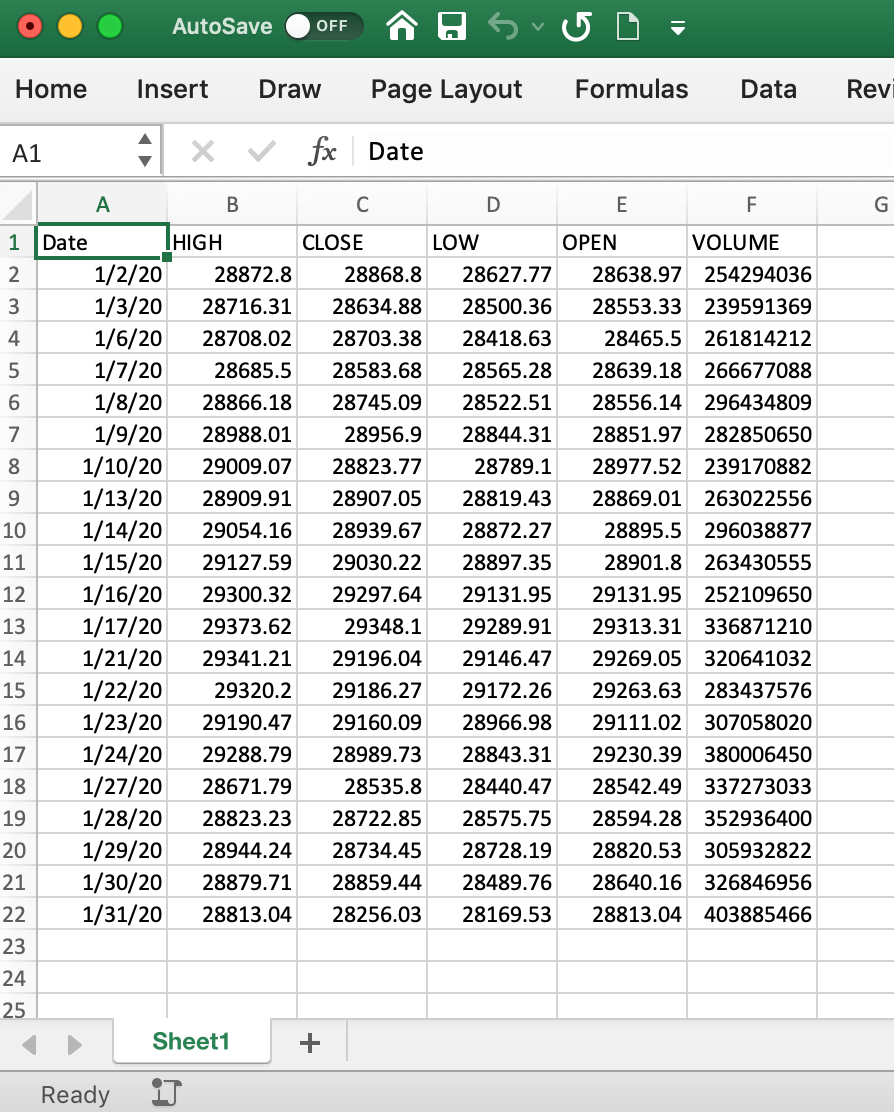
When running this script, a new Excel workbook opens up and the Pandas DataFrame that the get_timeseries call returns will be written to cell A1:
A first basic template
Instead of writing the data to a new Excel workbook, we can also write it to an existing file which has been formatted to look a bit nicer than an empty spreadsheet. Let’s create a new Excel file and save it as sample2.xlsx. Then style it like so:
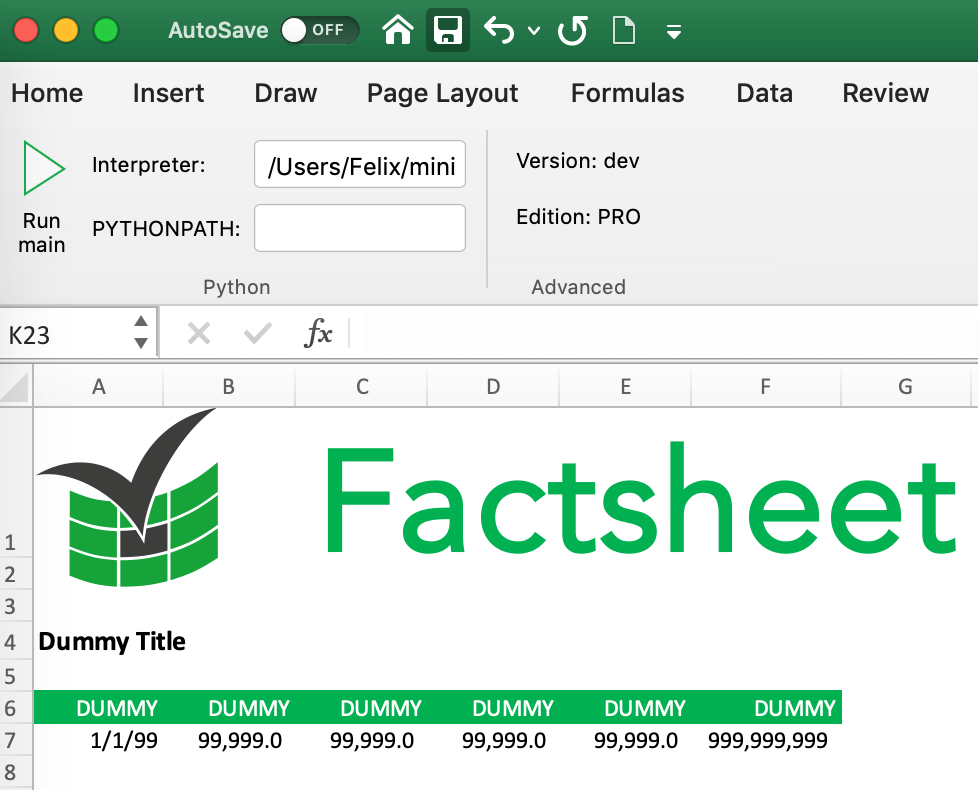
If you can, use an svg file for your logo instead of a jpg or png file as the printing quality will be much better. After styling the Dummy Title and the table, you can remove the dummy text again if you like. Next, let’s enhance the above script slightly as follows and save it as sample2.py:
# sample2.py
import eikon as ek
import xlwings as xw
# Please read your Eikon APP_KEY from a config file or environment variable
ek.set_app_key('YOUR_APP_KEY')
def main():
# These parameters could also come from a config sheet in the template
instrument = '.DJI'
start_date = '2020-01-01'
end_date = '2020-01-31'
# Eikon queries
df = ek.get_timeseries(instrument,
fields='*',
start_date=start_date,
end_date=end_date)
summary, err = ek.get_data(instrument,
['TR.IndexName', 'TR.IndexCalculationCurrency'])
# Populate the Excel template with the data
wb = xw.Book.caller()
wb.sheets[0]['A4'].value = f"{summary.loc[0, 'Index Name']} ({summary.loc[0, 'Calculation Currency']})"
wb.sheets[0]['A6'].value = df
if __name__ == '__main__':
xw.Book('sample2.xlsx').set_mock_caller()
main()
Make sure to place sample2.xlsx and sample2.py in the same directory (that’s not a hard requirement, it’s only because we haven’t used a full file path here). We can now run the script again via python sample2.py or - if you have the xlwings add-in installed, we can simply click on the Run main button (see screenshot above) which will give us this result:
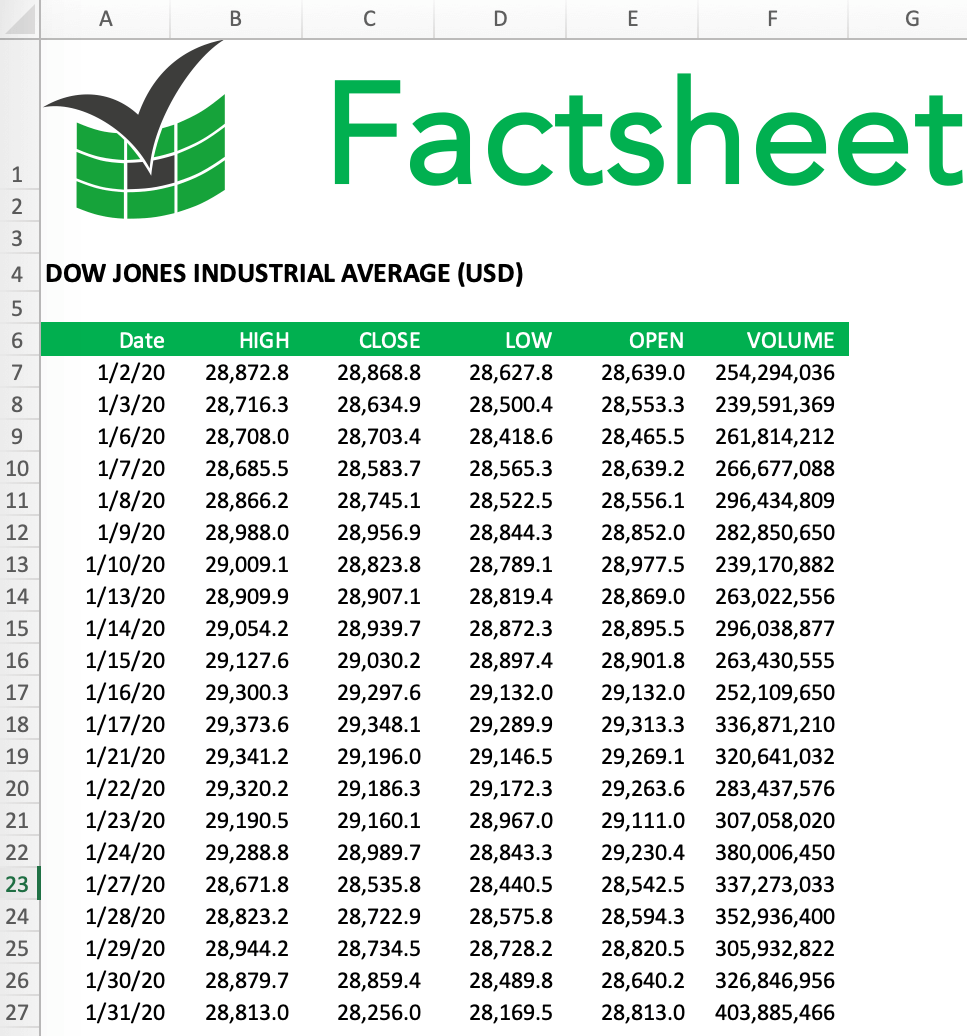
Quite a bit nicer already! Note that in this setup, the template gets populated with the data directly, so you may want to add some logic to copy the template first to a new file or let xlwings PRO take care of this as shown in the next section.
Reporting with xlwings PRO
While the above setup will get you quite far for simple reports, it has some limits:
- If, for example, you insert a few rows below the logo, you will have to adjust the cell references accordingly in the Python code. Using named ranges could help but they have other limitations (like the one mentioned at the end of this list).
- The number of rows in the table will vary. This leads to two issues: (a) data rows might not be formatted consistently and (b) content below the table might get overwritten if the table is too long.
- Placing the same value in a lot of different cells (e.g. a date in the source note of every table or chart) will cause duplicated code or unnecessary loops.
To fix these issues, xlwings PRO comes with a dedicated reports package:
- Separation of code and design: Users without coding skills can change the template on their own without having to touch the Python code.
- Template variables: Python variables (between curly braces) can be directly used in cells , e.g. {{ title }}. They act as placeholders that will be replaced by the actual values.
- Frames for dynamic tables: Frames are vertical containers that dynamically align and style tables that have a variable number of rows.
You can get a free trial for xlwings PRO here. To start using the reports package, change your code as follows and save it as sample3.py:
# sample3.py
import os
import eikon as ek
import xlwings as xw
from xlwings.reports import create_report
# Please read your Eikon APP_KEY from a config file or environment variable
ek.set_app_key('YOUR_APP_KEY')
def main():
# These parameters could also come from a config sheet in the template
instrument = '.DJI'
start_date = '2020-01-01'
end_date = '2020-01-31'
# Eikon queries
df = ek.get_timeseries(instrument,
fields='*',
start_date=start_date,
end_date=end_date)
summary, err = ek.get_data(instrument,
['TR.IndexName', 'TR.IndexCalculationCurrency'])
# Populate the Excel template with the data
template = xw.Book.caller().fullname
wb = create_report(template=template,
output=os.path.join(os.path.dirname(template), 'factsheet.xlsx'),
title=f"{summary.loc[0, 'Index Name']} ({summary.loc[0, 'Calculation Currency']})",
df=df)
if __name__ == '__main__':
xw.Book('sample3.xlsx').set_mock_caller()
main()
As you see, we don’t have any hard coded cell references anymore, we simply stick all variables into the create_report call and that’s it!
Now we can turn to our Excel template, save it as sample3.xlsx and change it as follows:
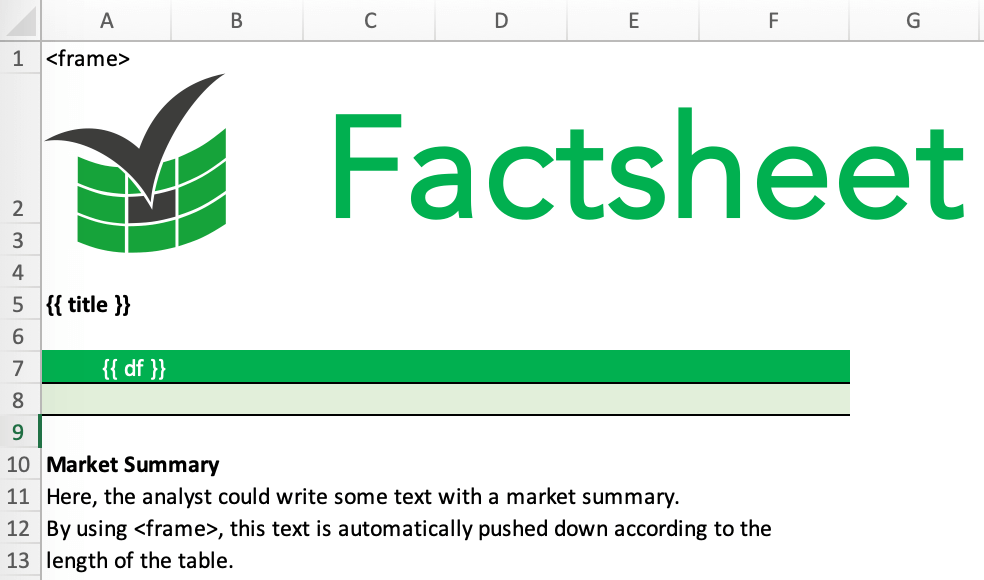
A few things to point out:
- We inserted a first row with a <frame> tag. This defines a vertical container in which tables are expanded dynamically. You could introduce a multi-column layout by inserting a another <frame> to the right.
- Unlike before, we are formatting the data row of the table with a background color and borders.
- Below the table we have added a text block.
- We have placed the {{ title }} and {{ df }} placeholders in cells A5 and A7, respectively.
By clicking the Run main button or running the script via python sample3.py, we will end up with this report:
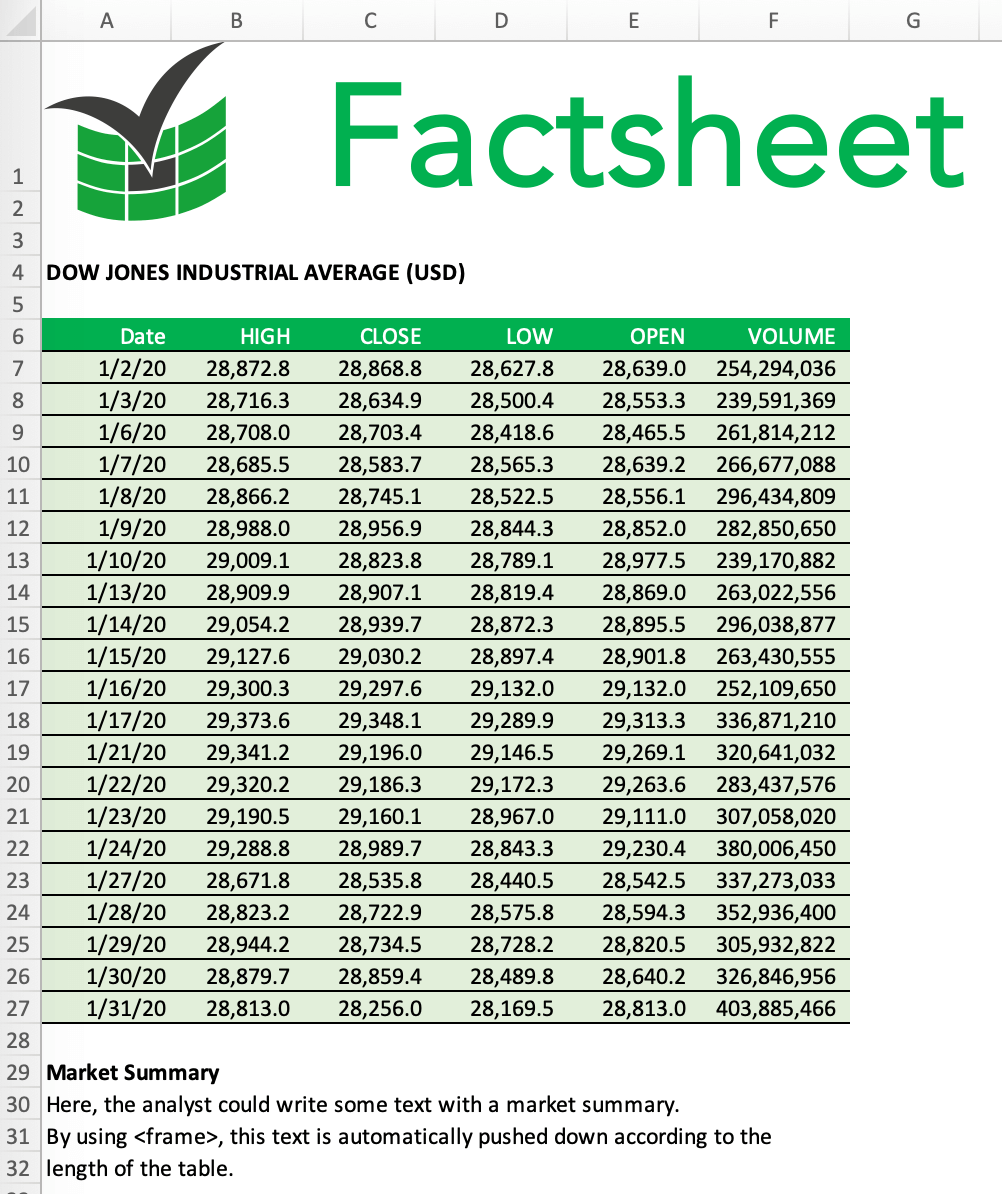
Note that the create_report call automatically created a copy of the template so you never run the risk to inadvertently overwrite it. Also, the table’s row formatting has been applied to the whole table and the text below the table was pushed down correctly.
A real world example
The previous samples were deliberately simple so we could introduce the different concepts. However, if you combine the create_reports call with standard xlwings functionality, you can achieve almost anything you want and save hours of manual formatting or copy/pasting every day.
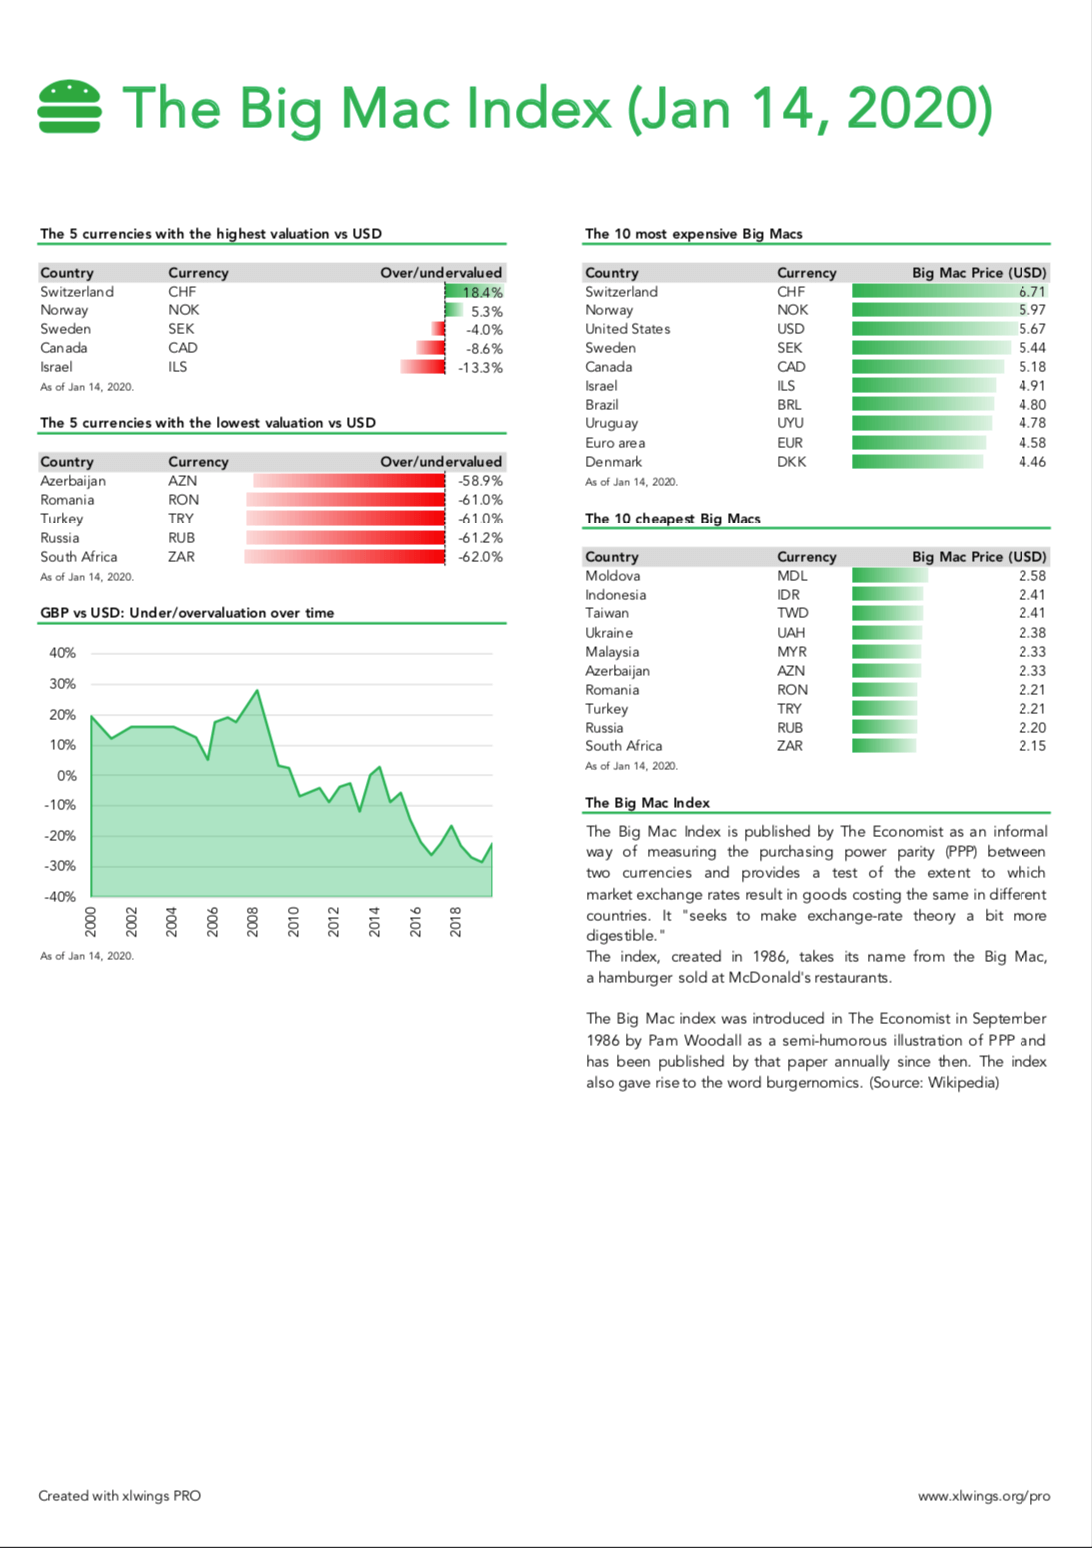
The repository that you can find under https://github.com/xlwings/xlwings-demo/tree/master/reporting_bigmac has a much more real world reporting sample with a 2-column layout and a settings tab:
For further details about the reports package, please see the xlwings PRO docs. For example, you can run the report in a separate and hidden instance of Excel or handle external links and passwords.
Conclusion
It’s really easy to produce professional reports with Python by using Eikon as the data source and xlwings as the connection between Excel and Python. While xlwings CE gets you started, the reports package in xlwings PRO will allow you to properly deal with dynamic tables and separate the job between data acquisition/manipulation and report design.