
Author

Jirapongse Phuriphanvichai
Developer Advocate
The EMA performance tools comprise a unified, open‑source suite of applications that measure key aspects of real‑time data delivery—including throughput, latency, and overall system efficiency—across LSEG’s Open Message Model APIs. These tools emulate demanding consumer and provider workloads, leveraging embedded timestamps to capture precise end‑to‑end latency metrics and producing comprehensive statistics on update rates, image retrieval performance, CPU utilization, and memory footprint. Through buildable source code and customizable test scenarios, the suite enables developers to rigorously benchmark their systems, compare API performance, and optimize applications for high‑speed, scalable operation.
These are the same tools the product team uses to produce the Performance Report, with a summary provided in the Real-Time SDKs Performance Test Summary article. This article describes how to use the EMA C++Interactive Provider and Consumer performance tools to evaluate API throughput and latency in various supported deployment environments.
Note: For the EMA C++ Interactive Provider and Consumer performance tools, please refer to this Benchmarking Throughput and Latency Using EMA C++ Non-Interactive Provider and Consumer Performance Tools article.
EMA Performance Tools
The Real-time C/C++ SDK contains the following three EMA performance tools, EMACppIProvPerf, EMACppNIProvPerf, and EMACppConsPerf.
1. EMACppIProvPerf (Interactive Provider Performance Tool)
It is an interactive provider that accepts consumer connections—either directly or through the LSEG Real‑Time Distribution System—and supplies refresh, update, and optional generic messages. It simulates high‑volume publishing by generating data internally, handling login and directory requests, and sending configurable bursts of updates. The tool embeds timestamps in outgoing messages for latency measurement and supports multi‑threading to distribute consumer connections evenly across processing threads.
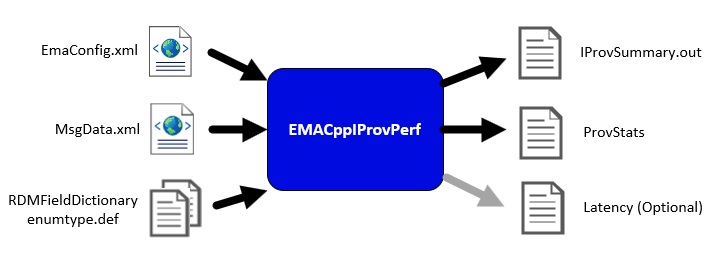
To run EmaCppIProvPerf, the user needs to provide the EMA configuration file (EmaConfig.xml), the message template file (MsgData.xml), and the data dictionary files (RDMFieldDictionary and enumtype.def). During execution, the tool produces a summary output (ProvSummary.out), a statistics file (ProvStats), and, if latency options are configured, an optional latency output file.
2. EMACppNIProvPerf (Non‑Interactive Provider Performance Tool)
It is a non‑interactive provider that publishes real‑time content directly into an LSEG Real‑Time Advanced Distribution Hub without requiring consumer requests. After logging in and publishing its service directory, it continually sends images and high‑rate updates for configured items, using timestamps to support latency measurement. The tool supports multi‑threaded publishing—where each thread opens its own ADH connection—and erecords statistics such as updates sent, CPU usage, and memory consumption to help assess system performance under sustained publishing loads.
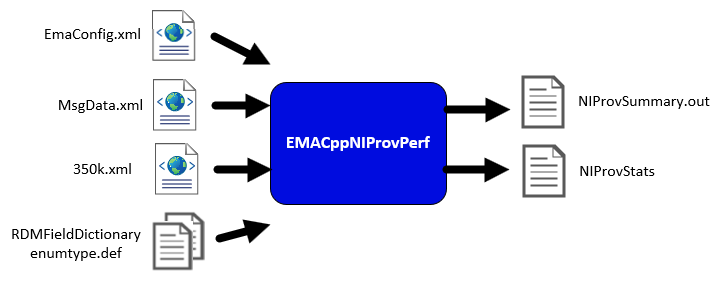
To run EmaCppNIProvPerf, the user needs to provide the EMA configuration file (EmaConfig.xml), the message template file (MsgData.xml), the item list file (350k.xml) and the data dictionary files (RDMFieldDictionary and enumtype.def). During execution, the tool produces a summary output (NIProvSummary.out), and a statistics file (NIProvStats). EMACppNIProvPerf does not generate a latency file.
3. EMACppConsPerf (Consumer Performance Tool)
It is a high‑performance Open Message Model (OMM) consumer that measures how efficiently a system can request, receive, and process real‑time market data. It issues large, configurable sets of item requests, processes refresh and update messages, and gathers detailed statistics such as update rates, image retrieval time, and latency. The tool embeds and detects timestamps to calculate both update and posting latency and supports multi‑threaded scaling, allowing multiple consumer connections for realistic workload simulation.
To run EmaCppConsPerf, the user needs to provide the EMA configuration file (EmaConfig.xml), the message template file (MsgData.xml) ), the item list file (350k.xml), and the data dictionary files (RDMFieldDictionary and enumtype.def). During execution, the tool produces a summary output (ConsSummary.out), a statistics file (ConsStats), and, if latency options are configured, an optional latency output file.
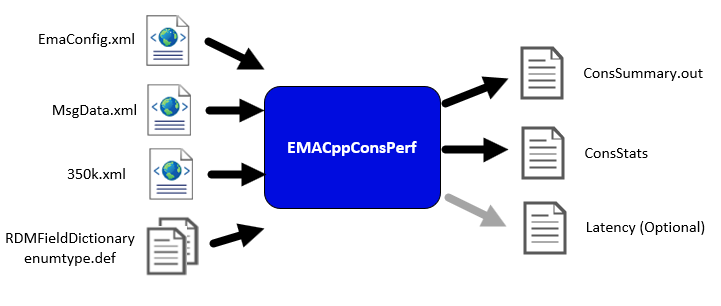
Note: The EMA configuration file (EmaConfig.xml), the message template file (MsgData.xml), the item list file (350k.xml), and the data dictionary files (RDMFieldDictionary and enumtype.def) are available in the Real-Time SDK C/C++ package.
This article will focus on the EMACppIProvPerf and EMACppConsPerf tools.
Architecture Overview
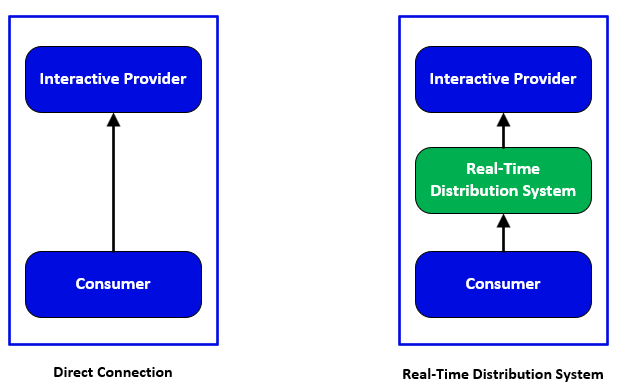
A consumer can connect to an interactive provider through two primary models. In a direct connection, the consumer connects straight to the provider’s endpoint and manages login, directory, and item requests independently. This approach offers low latency and simplicity due to its point‑to‑point nature. Alternatively, a consumer can connect through an RTDS (Real-Time Distribution System), such as an Advanced Distribution Server. In this model, RTDS acts as an intermediary, providing scalability, caching, fan-out capabilities, resiliency, and centralized control, making it better suited for larger deployments despite slightly higher latency.
API Throughput
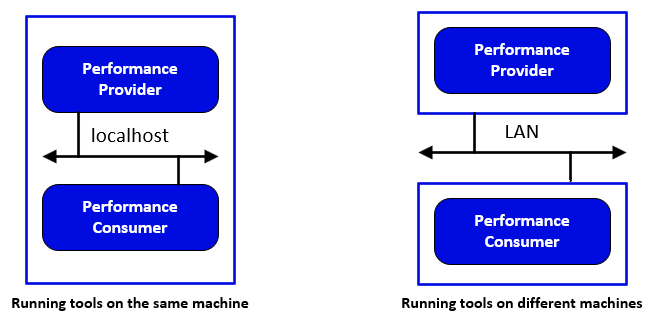
API throughput measures how many messages a system can process per second under load. It is typically evaluated using EMA performance tools, which simulate realistic traffic by sending update, request, generic, and post messages at controlled rates governed by a configurable tick rate. The tools collect metrics such as message rates, image retrieval time, and per-thread processing statistics, storing results in summary and statistics files. Throughput depends on factors including CPU and thread configuration, buffering behavior, message packing, and network tuning (such as disabling Nagle’s algorithm). Tests may be conducted on a single machine to isolate API performance or across multiple machines to include network effects.
API Latency
API latency is the time a message takes to travel from sender to receiver. It is measured by embedding high-resolution timestamps in specific fields—TIM_TRK_1, TIM_TRK_2, and TIM_TRK_3—when update, post, and generic messages are encoded. Upon receipt, the application extracts the timestamp and compares it with the current time to calculate end-to-end latency. Messages are sent in bursts based on a configured tick rate, with one message per burst randomly selected for latency tracking to ensure representative sampling. Accurate one-way latency measurement requires both applications to run on the same host due to clock synchronization constraints, although this limitation does not apply to posting scenarios.
For post-message measurement, the consumer sends messages with an embedded timestamp to the interactive provider. The provider preserves this timestamp, re-encodes the payload into update messages, and returns them to the consumer. The consumer then uses the returned timestamp to calculate round-trip latency, enabling both applications to run on separate machines.
Latency results typically include average, minimum, maximum, and standard deviation values, with optional logging of individual measurements for deeper analysis. Together, throughput and latency measurements provide a comprehensive view of system performance, enabling developers to identify bottlenecks and optimize real-time data delivery.
The followings are steps to run EMACppIProvPerf and EMACppConsPerf tools.
Run EMACppIProvPerf Tool
Follow these steps to run the EMACppIProvPerf tool to measure API performance.
1. Copy EmaConfig.xml, MsgData.xml, RDMFieldDictionary, and enumtype.def from the RTSDK package into the current EMACppIProvPerf tool directory.
2. Configure the EMA configurations. The EmaConfig.xml file contains the Perf_Provider_1 configuration for the interactive provider performance tool.
<IProviderGroup>
<IProviderList>
…
<IProvider>
<Name value="Perf_Provider_1"/>
<Server value="Perf_Server_1"/>
<Directory value="Directory_2"/>
<Logger value="Logger_1"/>
<ItemCountHint value="100000"/>
...
</IProvider>
…
</IProviderList>
</IProviderGroup>
…
<ServerGroup>
<ServerList>
…
<Server>
<Name value="Perf_Server_1"/>
<ServerType value="ServerType::RSSL_SOCKET"/>
<CompressionType value="CompressionType::None"/>
<GuaranteedOutputBuffers value="50000"/>
<ConnectionPingTimeout value="30000"/>
<TcpNodelay value="1"/>
<Port value="14002"/>
...
</Server>
</ServerList>
</ServerGroup>
…
<DirectoryGroup>
<DirectoryList>
<Directory>
<Name value="Directory_2"/>
<Service>
<Name value="DIRECT_FEED"/>
<InfoFilter>
<ServiceId value="1"/>
<DictionariesProvided>
<DictionariesProvidedEntry value="Dictionary_3"/>
</DictionariesProvided>
<DictionariesUsed>
<DictionariesUsedEntry value="Dictionary_3"/>
</DictionariesUsed>
<Vendor value="company name"/>
<IsSource value="0"/>
<Capabilities>
<CapabilitiesEntry value="MMT_DICTIONARY"/>
<CapabilitiesEntry value="MMT_MARKET_PRICE"/>
…
</Capabilities>
<QoS>
<QoSEntry>
<Timeliness value="Timeliness::RealTime"/>
<Rate value="Rate::TickByTick"/>
</QoSEntry>
…
</QoS>
</InfoFilter>
<StateFilter>
<ServiceState value="1"/>
<AcceptingRequests value="1"/>
</StateFilter>
</Service>
</Directory>
</DirectoryList>
</DirectoryGroup>
…
<DictionaryGroup>
<DictionaryList>
…
<Dictionary>
<Name value="Dictionary_3"/>
<DictionaryType value="DictionaryType::FileDictionary"/>
<RdmFieldDictionaryFileName value="./RDMFieldDictionary"/>
<EnumTypeDefFileName value="./enumtype.def"/>
</Dictionary>
…
</DictionaryList>
</DictionaryGroup>
This interactive provider configuration uses the Perf_Server_1 server configuration, which listens on TCP port 14002. It also uses the Directory_2 configuration to publish the DIRECT_FEED service, which in turn uses the Dictionary_3 configuration to load dictionaries from local files in the current directory.
3. Run the EMACPPIProvPerf by specifying the Perf_Provider_1 to the providerName parameter.
-providerName Perf_Provider_1
The application will run using the Perf_Provider_1 provider’s configuration, with all other settings remaining at their defaults.
--- TEST INPUTS ---
Run Time (-runTime): 360
Provider Name (-providerName): Perf_Provider_1
useUserDispatch (-useUserDispatch): No
mainThread CpuId (-mainThread): -1
Thread List (-threads): -1
Api thread List (-apiThreads): -1
Worker thread List (-workerThreads): -1
Summary File (-summaryFile): IProvSummary.out
Stats File (-statsFile): Provstats
Latency Log File (-latencyFile): (none)
Write Stats Interval (-writeStatsInterval): 5
Display Stats (-noDisplayStats): Yes
Tick Rate (-tickRate): 1000
Update Rate (-updateRate): 100000
Latency Update Rate (-latencyUpdateRate): 10
Generic Msg Rate (-genericMsgRate): 0
Latency Generic Msg Rate (-genericMsgLatencyRate): 0
Refresh Burst Size (-refreshBurstSize): 10
Data File (-msgFile): MsgData.xml
Pre-Encoded Updates (-preEnc): No
Nanosecond Time (-nanoTime): No
Measure Encode (-measureEncode): No
The default settings can be changed via the corresponding application’s parameters. For more information regarding these parameters, please refer to the EMA C++ OPEN SOURCE PERFORMANCE TOOLS GUIDE in the Real-Time SDK C/C++ package.
4. (Optional) If the Real-Time Distribution System (RTDS) is used, configure the RTDS to connect to the EMACppIProvPerf application to consume the DIRECT_FEED service.
With the default parameters, the application publishes update messages at a rate of 100,000 updates per second, with timestamps embedded in the TIM_TRK_1 (3902) field and generates a summary file (IProvSummary.out) and a statistic file (Provstats.csv).
Additionally, EMACppIProvPerf can be configured to publish generic messages with timestamps in the TIM_TRK_3 (3904) field. This behavior is controlled by the -genericMsgRate and -genericMsgLatencyRate parameters.
Run EMACppConsPerf Tool
After running the EMACppIProvPerf tool, you can configure and run the EMACppConsPerf tool to measure API performance in the consumer side. The EMACppConsPerf tool can connect to the EMACppIProvPerf tool either directly or through the Real-Time Distribution System (RTDS).
Follow these steps to run the EMACppConsPerf tool to measure API performance.
1. Copy EmaConfig.xml, MsgData.xml, 350k.xml, RDMFieldDictionary, and enumtype.def from the RTSDK package into the current EMACppConsPerf tool directory.
2. Configure the EMA configurations. The EmaConfig.xml file contains the Perf_Consumer_2 configuration for the consumer performance tool.
<ConsumerGroup>
<ConsumerList>
…
<Consumer>
<Name value="Perf_Consumer_2"/>
<Channel value="Perf_Channel_1"/>
<Logger value="Logger_1"/>
<Dictionary value="Dictionary_2"/>
<MaxDispatchCountApiThread value="6500"/>
<MaxDispatchCountUserThread value="6500"/>
</Consumer>
…
</ConsumerList>
</ConsumerGroup>
…
<ChannelGroup>
<ChannelList>
…
<Channel>
<Name value="Perf_Channel_1"/>
<ChannelType value="ChannelType::RSSL_SOCKET"/>
<CompressionType value="CompressionType::None"/>
<GuaranteedOutputBuffers value="5000"/>
<NumInputBuffers value="2048"/>
<ConnectionPingTimeout value="30000"/>
<TcpNodelay value="1"/>
<Host value="localhost"/>
<Port value="14002"/>
</Channel>
…
</ChannelList>
</ChannelGroup>
…
<DictionaryGroup>
<DictionaryList>
…
<Dictionary>
<Name value="Dictionary_2"/>
<DictionaryType value="DictionaryType::FileDictionary"/>
<RdmFieldDictionaryFileName value="./RDMFieldDictionary"/>
<EnumTypeDefFileName value="./enumtype.def"/>
</Dictionary>
…
</DictionaryList>
</DictionaryGroup>
This consumer configuration uses the Perf_Channel_1 channel, which connects to localhost on TCP port 14002. It also uses Dictionary_2, which loads dictionary files from the current directory. If required, you can modify the Host setting in the Perf_Channel_1 channel to specify the IP address or hostname of the RTDS or the system running the EMACppIProvPerf tool.
3. Run the EMACPPConsPerf by specifying the Perf_Consumer_2 to the consumerName parameter.
-consumerName Perf_Consumer_2
The application will run using the Perf_Consumer_2 consumer’s configuration, with all other settings remaining at their defaults.
--- TEST INPUTS ---
Steady State Time (-steadyStateTime): 300
Delay Steady State Time (-delaySteadyStateCalc): 0
Service (-serviceName): DIRECT_FEED
useUserDispatch (-useUserDispatch): 0
mainThread (-mainThread): -1
Thread List (-threads): -1
ApiThread List (-apiThreads): -1
WorkerThread List (-workerTheads): -1
Username (-uname): (use system login name)
Item Count (-itemCount): 100000
Common Item Count (-commonItemCount): 0
Request Rate (-requestRate): 35000
Request Snapshots (-snapshot): No
Posting Rate (-postingRate): 0
Latency Posting Rate (-postingLatencyRate): 0
Generic Msg Rate (-genericMsgRate): 0
Latency Generic Msg Rate (-genericMsgLatencyRate): 0
Item File (-itemFile): 350k.xml
Data File (-msgFile): MsgData.xml
Summary File (-summaryFile): ConsSummary.out
Stats File (-statsFile): ConsStats
Latency Log File (-latencyFile): (none)
Tick Rate (-tickRate): 1000
Security Protocol (-spTLSv1.2, -spTLSV1.3): NONE (default)
The default settings can be changed via the corresponding application’s parameters. For more information regarding these parameters, please refer to the EMA C++ OPEN SOURCE PERFORMANCE TOOLS GUIDE in the Real-Time SDK C/C++ package.
The API throughput benchmark can be determined from the Update rate (msg/sec) field in the EMACppConsPerf's statistic file (ConsStats1.csv).
With these default parameters, the application subscribes to 100,000 items from the DIRECT_FEED service and generates both a summary file (ConsSummary.out) and a statistics file (ConsStats.csv).
Additionally, EMACppConsPerf can be configured to publish generic messages with timestamps embedded in the TIM_TRK_3 (3904) field, and to send post messages with timestamps embedded in the TIM_TRK_2 (3903) field. The behavior of generic messages is controlled by the -genericMsgRate and -genericMsgLatencyRate parameters, while the behavior of post messages is controlled by the -postingRate and -postingLatencyRate parameters.
API Performance Benchmark
The performance of the API can be determined from the generated statistic files.
Throughput
The thoughput can be determined from the messages sent and received per interval (-writeStatsInterval).
For the EMACppIProvPerf tool, the following fields can be used to determine the API throughput.
Field Name |
Description |
Requests received |
The number of item request messages received per interval |
Images sent |
The number of item refresh messages sent per interval |
Updates sent |
The number of item update messages sent per interval |
Posts reflected |
The number of post messages received per interval |
GenMsgs sent |
The number of generic messages sent per interval |
GenMsgs received |
The number of generic messages received per interval |
For the EMACppConsPerf tool, the following fields can be used to determine the API throughput.
Field Name |
Description |
Images |
The number of item refresh messages received per interval |
Update rate (msg/sec) |
The number of item update messages received per second |
GenMsgs sent |
The number of generic messages sent per interval |
GenMsgs received |
The number of generic messages received per interval |
Latency
Latency values are derived from the timestamps embedded in the retrieved messages.
For the EMACppIProvPerf tool, the following fields can be used to determine the API latency.
Field Name |
Description |
GenMsg Latencies received |
The number of generic messages containing timestamps received per interval. |
GenMsg Latency avg (usec) |
The average latency, in microseconds, calculated from generic messages containing timestamps received during each interval. |
GenMsg Latency std dev (usec) |
The standard deviation of latency, in microseconds, calculated from generic messages containing timestamps received during each interval. |
GenMsg Latency max (usec) |
The maximum latency, in microseconds, observed from generic messages containing timestamps during each interval. |
GenMsg Latency min (usec) |
The minimum latency, in microseconds, observed from generic messages containing timestamps during each interval. |
For the EMACppConsPerf tool, the following fields can be used to determine the API latency.
Field Name |
Description |
Latency updates |
The number of update messages containing timestamps received per interval. |
Latency avg (usec) |
The average latency, in microseconds, calculated from update messages containing timestamps received during each interval. |
Latency std dev (usec) |
The standard deviation of latency, in microseconds, calculated from update messages containing timestamps received during each interval. |
Latency max (usec) |
The maximum latency, in microseconds, observed from update messages containing timestamps during each interval. |
Latency min (usec) |
The minimum latency, in microseconds, observed from update messages containing timestamps during each interval. |
Posting Latency updates |
The number of timestamped update messages received during each interval that are responses to post messages. |
Posting Latency avg (usec) |
The average latency, in microseconds, calculated from timestamped update messages received during each interval that are responses to post messages. |
Posting Latency std dev (usec) |
The standard deviation of latency, in microseconds, calculated from timestamped update messages received during each interval that are responses to post messages. |
Posting Latency max (usec) |
The maximum latency, in microseconds, observed from timestamped update messages received during each interval that are responses to post messages. |
Posting Latency min (usec) |
The minimum latency, in microseconds, observed from timestamped update messages received during each interval that are responses to post messages. |
GenMsg Latencies received |
The number of generic messages containing timestamps received per interval. |
GenMsg Latency avg (usec) |
The average latency, in microseconds, calculated from generic messages containing timestamps received during each interval. |
GenMsg Latency std dev (usec) |
The standard deviation of latency, in microseconds, calculated from generic messages containing timestamps received during each interval. |
GenMsg Latency max (usec) |
The maximum latency, in microseconds, observed from generic messages containing timestamps during each interval. |
GenMsg Latency min (usec) |
The minimum latency, in microseconds, observed from generic messages containing timestamps during each interval. |
Latency File
The latency file is an output file generated by the EMACppIProvPerf and EMACppConsPerf tools that record individual latency measurements for messages processed during a performance test. It stores per-message latency values rather than aggregated statistics. It is primarily used for detailed analysis, troubleshooting, and visualization.
To create this latency file, the -latencyFile parameter must be specified with a latency file name.
Sample Output
EMACppIProvPerf Statistics File
UTC, Requests received, Images sent, Updates sent, Posts reflected, GenMsgs sent, GenMsgs received, GenMSg Latencies sent, GenMsg Latencies received, GenMsg Latency avg (usec), GenMsg Latency std dev (usec), GenMsg Latency max (usec), GenMsg Latency min (usec), CPU usage (%), Memory (MB)
2026-05-22 07:35:13, 89136, 32583, 300, 0, 3, 0, 0, 0, 0.0, 0.0, 0.0, 0.0, 128.78, 545.47
2026-05-22 07:35:18, 10864, 67417, 5859, 488, 58, 488, 17, 49, 869.7, 325.8, 1558.0, 446.0, 133.11, 559.52
2026-05-22 07:35:23, 0, 0, 85158, 4992, 852, 4992, 77, 504, 550.8, 388.0, 4182.0, 125.0, 139.31, 559.59
2026-05-22 07:35:28, 0, 0, 71314, 5015, 713, 5015, 79, 499, 657.2, 292.1, 2044.0, 121.0, 149.60, 559.59
2026-05-22 07:35:33, 0, 0, 58729, 4995, 587, 4995, 57, 504, 717.6, 293.2, 2400.0, 202.0, 143.60, 559.59
2026-05-22 07:35:38, 0, 0, 65467, 5001, 655, 5001, 54, 493, 669.1, 246.8, 1558.0, 117.0, 148.06, 559.59
2026-05-22 07:35:43, 0, 0, 62959, 4997, 629, 4997, 76, 504, 632.1, 239.1, 1364.0, 121.0, 145.74, 559.59
2026-05-22 07:35:48, 0, 0, 67656, 5002, 677, 5001, 65, 498, 544.3, 159.9, 2103.0, 150.0, 139.00, 559.59
2026-05-22 07:35:53, 0, 0, 54751, 5002, 547, 5003, 49, 505, 528.6, 149.3, 1421.0, 200.0, 149.31, 559.59
2026-05-22 07:35:58, 0, 0, 109004, 5000, 1090, 5000, 108, 493, 515.6, 155.7, 1724.0, 245.0, 146.86, 559.59
EMACppIProvPerf Latency File
Message type, Send time, Receive time, Latency (usec)
Gen, 20352336724, 20352338067, 1343
Gen, 20352337860, 20352338914, 1054
Gen, 20352337958, 20352339311, 1353
Gen, 20352340760, 20352341322, 562
Gen, 20352341356, 20352342474, 1118
Gen, 20352346613, 20352347598, 985
Gen, 20352349325, 20352349960, 635
Gen, 20352350082, 20352350677, 595
Gen, 20352355930, 20352356655, 725
Gen, 20352356766, 20352358324, 1558
Gen, 20352360828, 20352361750, 922
EMACppConsPerf Statistic File
UTC, Latency updates, Latency avg (usec), Latency std dev (usec), Latency max (usec), Latency min (usec), Images, Update rate (msg/sec), Posting Latency updates, Posting Latency avg (usec), Posting Latency std dev (usec), Posting Latency max (usec), Posting Latency min (usec), GenMsgs sent, GenMsgs received, GenMsg Latencies sent, GenMsg latencies received, GenMsg Latency avg (usec), GenMsg Latency std dev (usec), GenMsg Latency max (usec), GenMsg Latency min (usec), CPU usage (%), Memory (MB)
2026-05-22 07:35:13, 0, 0.0, 0.0, 0.0, 0.0, 27970, 60, 0, 0.0, 0.0, 0.0, 0.0, 0, 3, 0, 0, 0.0, 0.0, 0.0, 0.0, 113.92, 437.79
2026-05-22 07:35:18, 0, 0.0, 0.0, 0.0, 0.0, 71260, 20, 0, 0.0, 0.0, 0.0, 0.0, 0, 1, 0, 0, 0.0, 0.0, 0.0, 0.0, 53.25, 470.07
2026-05-22 07:35:23, 8, 544.1, 251.2, 909.0, 216.0, 770, 16944, 500, 1006.1, 619.8, 4678.0, 279.0, 4992, 797, 500, 81, 532.3, 295.7, 1366.0, 120.0, 142.48, 470.19
2026-05-22 07:35:28, 8, 302.4, 148.8, 613.0, 103.0, 0, 16427, 514, 931.3, 454.6, 3339.0, 240.0, 5059, 771, 514, 88, 546.0, 310.7, 1656.0, 91.0, 156.03, 470.19
2026-05-22 07:35:33, 7, 641.3, 323.9, 1340.0, 362.0, 0, 13119, 504, 1106.5, 421.7, 2751.0, 266.0, 5057, 605, 504, 59, 683.5, 288.9, 1799.0, 236.0, 174.21, 470.19
2026-05-22 07:35:38, 6, 492.3, 320.1, 1010.0, 182.0, 0, 14007, 507, 1046.1, 417.2, 2938.0, 315.0, 5052, 650, 508, 51, 656.1, 241.1, 1434.0, 170.0, 172.63, 470.23
2026-05-22 07:35:43, 5, 693.2, 227.1, 951.0, 349.0, 0, 13857, 510, 954.1, 363.4, 2448.0, 297.0, 5056, 642, 509, 79, 593.8, 228.9, 1288.0, 147.0, 167.77, 470.23
2026-05-22 07:35:48, 7, 483.6, 145.5, 648.0, 234.0, 0, 14667, 500, 797.4, 227.5, 1607.0, 407.0, 5051, 683, 500, 64, 469.4, 142.9, 871.0, 173.0, 150.02, 470.23
2026-05-22 07:35:53, 8, 445.5, 203.4, 878.0, 272.0, 0, 12062, 506, 808.3, 240.4, 1873.0, 478.0, 5066, 552, 506, 49, 528.4, 147.2, 979.0, 260.0, 142.81, 470.23
2026-05-22 07:35:58, 6, 329.7, 122.2, 501.0, 187.0, 0, 22780, 500, 776.5, 236.6, 2556.0, 343.0, 5047, 1089, 500, 109, 427.0, 164.8, 1029.0, 153.0, 153.22, 470.23
2026-05-22 07:36:03, 12, 468.7, 107.2, 666.0, 258.0, 0, 12188, 511, 774.9, 204.1, 1731.0, 465.0, 5061, 559, 511, 60, 483.3, 162.6, 934.0, 184.0, 152.52, 470.23
2026-05-22 07:36:08, 3, 423.3, 184.1, 560.0, 214.0, 0, 13991, 500, 782.9, 212.3, 1593.0, 489.0, 5049, 649, 500, 60, 501.2, 177.8, 1050.0, 243.0, 147.63, 470.17
EMACppConsPerf Latency File
Message type, Send time, Receive time, Latency (usec)
Upd, 20352361871, 20352362238, 367
Upd, 20352370154, 20352370961, 807
Upd, 20352774743, 20352775472, 729
Upd, 20353089379, 20353089972, 593
Upd, 20354593009, 20354593918, 909
Upd, 20354912155, 20354912534, 379
Upd, 20355089619, 20355089835, 216
Upd, 20356751290, 20356751643, 353
Pst, 20352336063, 20352338432, 2369
Pst, 20352337841, 20352339448, 1607
Pst, 20352337939, 20352339480, 1541
Pst, 20352340741, 20352341866, 1125
Pst, 20352340775, 20352342665, 1890
Pst, 20352346576, 20352348527, 1951
Gen, 20352368099, 20352368976, 877
Gen, 20352375794, 20352376689, 895
Gen, 20352406894, 20352408260, 1366
Summary
The EMA C++ Performance Tools provide a comprehensive framework for benchmarking real-time data systems by measuring key metrics such as throughput, latency, and resource utilization. By simulating realistic workloads and embedding timestamps into messages, the tools enable accurate evaluation of system performance and help identify bottlenecks under various operating conditions.
This document focuses specifically on the EMACppIProvPerf (Interactive Provider) and EMACppConsPerf (Consumer) tools, which are commonly used together to measure end-to-end performance. These tools support configurable message rates, burst-based processing via tick rates, and multi-threaded scaling, allowing developers to test both direct connections and distributed environments.
Through detailed outputs such as summary, statistics, and optional latency files, developers can analyze both aggregated metrics and individual message timings. This enables informed optimization of applications to achieve low latency, high throughput, and efficient resource usage in real-time data delivery systems.
References
1. LSEG Data & Analytics. (2025, December). Enterprise Message API C++ Edition 3.9.2.L1 – Open Source Performance Tools Guide
- Register or Log in to applaud this article
- Let the author know how much this article helped you
If you require assistance, please
contact us here
Get In Touch

Related Articles
-
Benchmarking Throughput and Latency Using EMA C++ Non-Interactive Provider and Consumer Performance Tools
-
Real-Time SDKs Performance Test Summary
-
Choosing your Real-Time Streaming API
-
Introduction to Enterprise Message API
-
10 important things you need to know before you write a Refinitiv Real-Time application
-
Enterprise Message API (EMA) - Configuration Overview
Related APIs
Request Free Trial
Call your local sales team
Americas
All countries (toll free): +1 800 427 7570
Brazil: +55 11 47009629
Argentina: +54 11 53546700
Chile: +56 2 24838932
Mexico: +52 55 80005740
Colombia: +57 1 4419404
Europe, Middle East, Africa
Europe: +442045302020
Africa: +27 11 775 3188
Middle East & North Africa: 800035704182
Asia Pacific (Sub-Regional)
Australia & Pacific Islands: +612 8066 2494
China mainland: +86 10 6627 1095
Hong Kong & Macau: +852 3077 5499
India, Bangladesh, Nepal, Maldives & Sri Lanka:
+91 22 6180 7525
Indonesia: +622150960350
Japan: +813 6743 6515
Korea: +822 3478 4303
Malaysia & Brunei: +603 7 724 0502
New Zealand: +64 9913 6203
Philippines: 180 089 094 050 (Globe) or
180 014 410 639 (PLDT)
Singapore and all non-listed ASEAN Countries:
+65 6415 5484
Taiwan: +886 2 7734 4677
Thailand & Laos: +662 844 9576