Author

Estimating Monthly G.D.P. Figures Via an Income Approach
Only quarterly U.S.A. G.D.P. data is published; this article describes a method of estimating monthly such figures using monthly Total Compensation figures.
Introduction
Gross Domestic Product (G.D.P.) is often thought of and calculated with an Expenditure Approach such that GDP=C+I+G+(X−M) where C = Consumption, I = Investment, G = Government Spending, & (X–M) = Net Exports, but it is also possible to calculate it via a per worker Income Approach. With this approach, we may estimate G.D.P. Per Worker (G.D.P.P.W.) with Total Compensation Per Worker (T.C.P.W.) figures such that (as per Appendix 1 on GitHub's Notebook):

where 
We can then attempt to interpolate G.D.P.P.W. values at higher frequencies than they are officially released with higher wage/income figure releases (exempli gratia (e.g.): to compute monthly G.D.P. figures when only quarterly ones are released using monthly published Total Compensation data).
We have to be careful of a few difficulties outlined by Feldstein (2008) (MF hereon): "The relation between productivity [ id est (i.e.): G.D.P.] and wages has been a source of substantial controversy, not only because of its inherent importance but also because of the conceptual measurement issues that arise in making the comparison." (Feldstein (2008)). MF outlines several key factors (KF hereon) to consider when studying the question:
- "[An undeserved] focus on wages rather than total compensation. Because of the rise in fringe benefits and other noncash payments, wages have not risen as rapidly as total compensation. It is important therefore to compare the productivity rise with the increase of total compensation rather than with the increase of the narrower measure of just wages and salaries.” This is why this article will first focus on using Total Compensation (TC).
- “[… The] nominal compensation deflated by the CPI is not appropriate for evaluating the relation between productivity and compensation […] this implies that the real marginal product of labor should be compared to the wage deflated by the product price and not by some consumer price index. [...] The CPI differs from the nonfarm product price in several ways. The inclusion in the CPI, but not in the nonfarm output price index, of the prices of imports and of the services provided by owner occupied homes is particularly important." This is why this article will first focus on using Nominal T.C. deflated (made 'real') with the Nonfarm Business Sector Output Price Index Deflator (NBSOPID).
Keeping these points in mind, we will attempt to investigate the relationship between the United States of America( U.S.A.)'s Real G.D.P. (R.G.D.P.) and U.S.A.'s Real National Total Compensation (R.N.T.C.) in order to construct a framework allowing us to estimate monthly R.G.D.P. data when only quarterly data is published.
Numerical Approximation
Background
per Appendix 1 (on GitHub's Notebook):

It may seem needlessly convoluted to insert rt the way it was done above, but it was necessary due to the fact that we have rt estimates (rt with a hat) - we thus build our framework around it: since Total Compensation figures are released on a monthly basis, if we can construct an estimate for the linearly-time-variant rt we can then construct monthly G.D.P. figures (even though only quarterly ones are published).
This article will study the efficiency of the U.S.A. Real G.D.P. Per Worker To National Real Total Compensation Per Worker Ratio (RGDPPWTNRTCPWR) as the ratio rt.
Development Tools & Resources
The example code demonstrating the use case is based on the following development tools and resources:
- Refinitiv's DataStream Web Services (DSWS): Access to DataStream data. A DataStream or Refinitiv Workspace IDentification (ID) will be needed to run the code bellow.
- Python Environment: Tested with Python 3.7
- Packages: DatastreamDSWS, Numpy, Pandas, statsmodel, scipy and Matplotlib. The Python built in modules statistics, datetime and dateutil are also required.
Import libraries
We need to gather our data. Since Refinitiv's DataStream Web Services (DSWS) allows for access to the most accurate and wholesome end-of-day (E.O.D.) economic database (DB), naturally it is more than appropriate. We can access DSWS via the Python library "DatastreamDSWS" that can be installed simply by using pip installpip install.
The following are Python-built-in module/library, therefore it does not have a specific version number.
statistics, numpy, scipy and statsmodels are needed for datasets' statistical and mathematical manipulations
pandas will be needed to manipulate data sets
Setup Original Functions
Setup Data Sets
The cell below defines a function that translates DataStream data into a shape we can work with: a Pandas Dafaframe normalised to the 1st of the month that it was collected in.
The cell below defines a function that appends our monthly data-frame with chosen data
Setup plot functions
The cell below defines a function to plot data on one y axis.
The cell below defines a function to plot data on two y axis.
The cell below defines a function to plot data regressed on time.
Setup Statistics Tools
The cell below defines a function that creates and displays a table of statistics for all vectors (columns) within any two specified datasets.
U.S.A. Working Population Growth
We will use Yearly Geometric Growth rate when looking at geometric growth rates throughout this article, as outlined in Appendix 2.
We proportion of population which works. This includes only employed adults, excluding children (~ 20% of U.S.A.P.) and the elderly (~ 14% of U.S.A.P.). The cell below adds the United States of America's Working Population (USAWP) values to the data-frame 'df' and plots our population data this far:
Next we take the USA Working Population's first Difference, i.e.: USAWPDt = USAWPt - USAWPt-1
U.S.A.'s Working Population's single period (in this case: monthly) Geometric Growth is then defined as USAWPG as per Appendix 2 (on GitHub):

Total Compensation
As per MF's first KF, we use U.S.A. Nominal National Total Compensation (N.N.T.C.) - the nominal value of which is derived from National Nominal Personal Income Accounts. Note that this dataset is the inflows into accounts; this means that we do not need to include incomes from assets. Note also that deflators used to compute 'real' figures form 'nominal' are defined in Appendix 3.
National Nominal Total Compensation
We can now add out National Nominal Total Compensation (N.N.T.C.) data in our data-frame and plot if for good measure.

As per MF, Nonfarm Business Sector Output Price Index Deflator (NBSOPID) is used to calculate U.S.A.'s Real Total Compensation figures.
Since the incoming data is indexed on 2012 such that the 'RAW' and unaltered value from DataStream is RAWNBSOPIDt(2012−01−01) = 100 where t(2012−01−01) is the time subscript value for 01 January 2012, we define 1/NBSOPIDt as RAWNBSOPIDt/RAWNBSOPIDT. Note that the inversion of NBSOPIDt was only necessary as the raw values were inverted (such that NBSOPIDt = RAWNBSOPIDTRAWNBSOPIDt). NBSOPID figures are released every quarter - that's fine since we don't expect inflation to change too much from one month to the other, so quarterly data is sufficient.
U.S.A. National Real Total Compensation is defined as NRTCt = NBSOPIDt * NNTCt
U.S.A. National Real Total Compensation Per Worker is defined as NRTCPWt = NRTCt / USAPt
How does Total Compensation compare to G.D.P. through time?
The cell below adds U.S.A. Real G.D.P.'s quarterly data (both every quarter and every month) in net and in Trillions to the Pandas data-frame 'df':
The cell below adds U.S.A. Real G.D.P. per Capita (RGDPPC) and Per Worker (RGDPPW) to our Pandas data-frame (df) and plots our data concisely:
The cell below adds U.S.A. Real G.D.P. Per Worker To National Real Total Compensation Per Worker Ratio (RGDPPWTNRTCPWR) to our Pandas data-frame (df) and plots it:
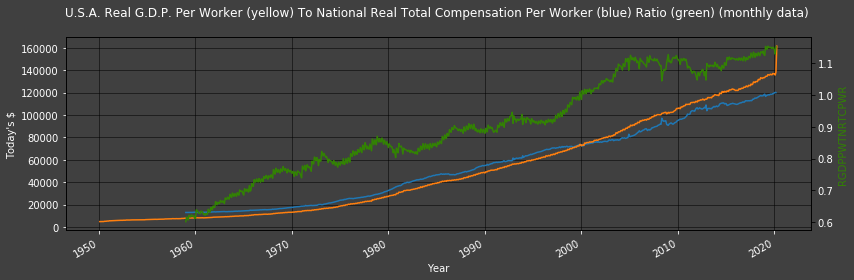
The graph above displays G.D.P. and Total Compensation per worker figures as well as the ratio between the two (the latter is shown in green). It is this ratio that we use as our 'r' is the estimation model:

Modelling:
The aim of our investigation is to find a ratio 'r' such that

Since (as per Appendix 1 on GitHub) we deffined rt = (RGDPPWt / RNTCPWt), rt-1 values do not need to be forecasted or modeled - we have the data needed to compute rt-1 = (RGDPPWt-1 / RNTCPWt-1).
rt values - however - require values of RGDPPWt for month t, which are not published: this is where an estimate of rt hat comes in useful.
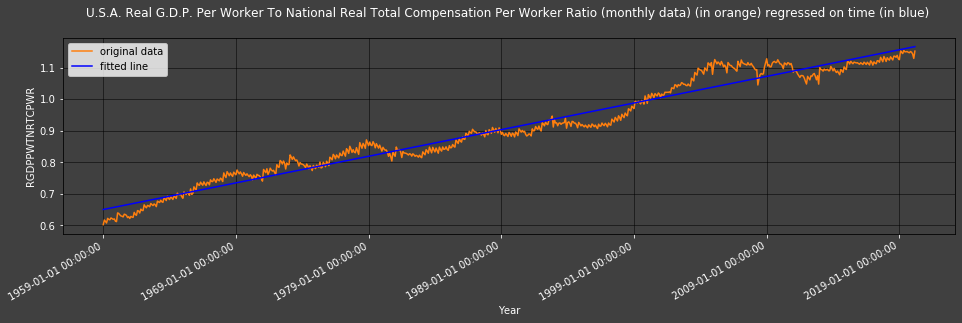
How may we model our estimate of rt? The first models that come to mind are linear regression models; the below investigates the regression of U.S.A. Real G.D.P. Per Worker To National Real Total Compensation Ratio (RGDPPWTNRTCPWR) against time (i.e.: months).
Regression of U.S.A. Real G.D.P. Per Worker To National Real Total Compensation Per Worker Ratio against time
Here we use RGDPPWTNRTCPWR as 'r' such that

xt is time in months, and c & beta are computed to reduce the error of this model via Ordinary Least Square estimation:
| Mean of Absolute Values | |
|---|---|
| RGDPPWTNRTCPWR (monthly data) | 0.907876 |
| RGDPPWTNRTCPWR regressed on months | 0.907876 |
| RGDPPWTNRTCPWR regressed on months' errors | 0.0241528 |
The statistics table shows a healthily low absolute (as in: ignoring the sign) error mean value for RGDPPWTNRTCPWR's regression model of 0.0241528. We seem to have gathered evidence that a time-linear model may be a good way to estimate r and then monthly G.D.P.. Remember that we will measure the effectiveness of our models by how they estimate G.D.P. values at lower frequencies than they are published by official bodies (here: monthly, using monthly released Total Compensation data); an accurate estimation of our ratio is therefore paramount. One may thus attempt to look at estimates produced by methods other than straight forward linear regressions, e.g.: the Holt-Winters method. Let's investigate that method too:
Holt-Winters method
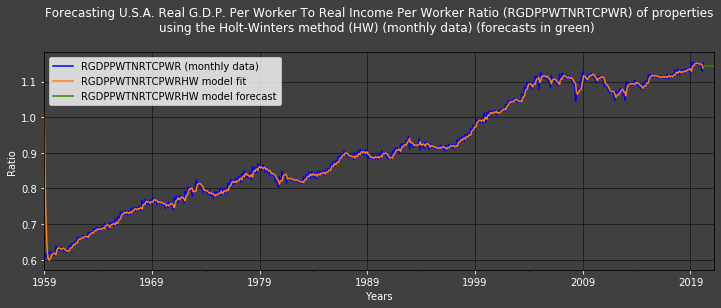
All estimation methods are to be used recursively. The Holt-Winters method makes sure that forecasts are heavily influenced by latest values by design. It offers better (i.e.: lower) model error (see model fit graph below) than our linear regressions too. \ Nota Bene (N.B.): A non multiplicative Holt-Winters method is used here as computational limits mean that multiplicative Holt-Winters methods result in very many 'NaN' estimates that are unusable.
The cell below creates recursive RGDPPWTNRTCPWR Holt-Winters exponential smoothing estimates (RGDPPWTNRTCPWRHW); this means that we are using RGDPPWTNRCTPWRt-1 as rt-1 and RGDPPWTNRCTPWRt as rt hat:
| Mean of Absolute Values | |
|---|---|
| RGDPPWTNRTCPWR regressed on months' errors | 0.0241528 |
| RGDPPWTNRTCPWRHW fitted values' real errors (monthly data) | 0.00773767 |
The Holt-Winters model's estimates - r hat - (in yellow) closely follow the realised RGDPPWTNRTCPWR values. This only holds untrue at the start (approximately for the first 2 years) when the model needs training. The (short) green line shows monthly forecasts for the next 4 years computed with this Holt-Winters model. \ The statistics table clearly hows that the Holt -Winters model performs much better than the time-linear regression model: its errors are - on average - a lot lower (i.e: 0.00773767<0.0241528).
Backtesting our Method
The Python function defined in the cell below returns the In-Sample Recursive Prediction values of ' data ' using the Holt-Winters exponential smoother Plus it then provides forecasts for One Out-Of-Sample period (thus the acronym 'ISRPHWPOOOF'):
We will back-test our models from January 1990
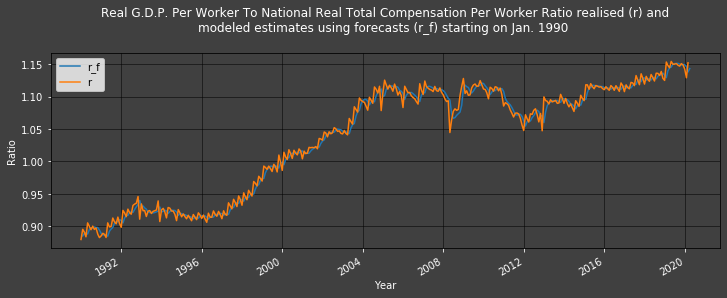
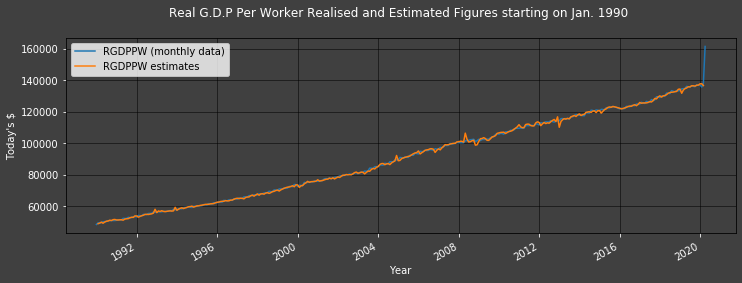
Modeled estimates (r_f) follow the realised r values so closely that it is difficult to differentiate them.
Yet again, looking at the realiations and model outputs on the same graph(s), it is difficult to see the model outputs because they follow realisations so well; the errors' graph and table shines a light on how small the error is:
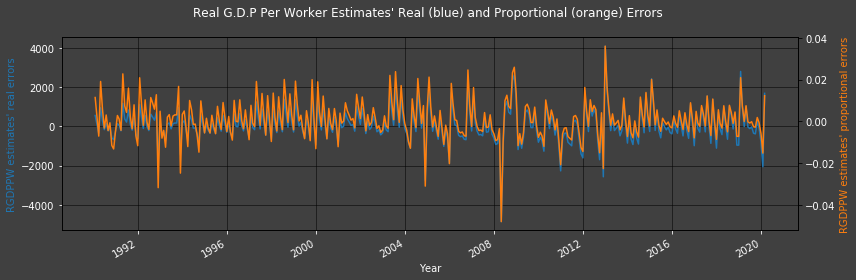
The difference between the lowest and 2nd lowest (as well as the highest and 2nd highest) troughs (and peaks) is less significant in the Proportional Error graph than in the straight forward Error graph.
Since R.G.D.P. figures are only released quarterly, it is best to investigate errors at each quarter
| Mean of Absolute Values | |
|---|---|
| RGDPPW estimates' errors | 592.39 |
| RGDPPW estimates' proportional errors | 0.00666185 |
Our model gave a healthily low error of 0.666185%.
Conclusion
We may now compute monthly estimates of G.D.P. figures using an Income Approach; since:

then:

df["RGDP estimates"] = df["RGDPPW estimates"] * df["USAWP (monthly data)"]
df[["RGDP (monthly data)", "RGDP estimates"]].dropna()
| RGDP (monthly data) | RGDP estimates | |
|---|---|---|
| 1990-02-01 | 5.872701e+12 | 5.805637e+12 |
| 1990-03-01 | 5.872701e+12 | 5.856728e+12 |
| 1990-04-01 | 5.872701e+12 | 5.914031e+12 |
| 1990-05-01 | 5.960028e+12 | 5.846246e+12 |
| 1990-06-01 | 5.960028e+12 | 5.925746e+12 |
| ... | ... | ... |
| 2019-11-01 | 2.172912e+13 | 2.168854e+13 |
| 2019-12-01 | 2.172912e+13 | 2.174243e+13 |
| 2020-01-01 | 2.172912e+13 | 2.185292e+13 |
| 2020-02-01 | 2.153794e+13 | 2.186431e+13 |
| 2020-03-01 | 2.153794e+13 | 2.127399e+13 |
It would be redundant testing the validity of these figures since we already did so when investigating Real G.D.P. Per Worker estimates above.
Note also that for values today - at time T - and/or close to today (e.g.: next month), RGDP is approximately equal to GDP, and population growth is negligable, such that USAWPT is approximately equal to USAWPT+1, then:

It is therefore possible to use our method to predict future GDP values on a monthly basis.
df
| USAWP (monthly data) | USAWPD (monthly data) | USAWPG (monthly data) | NNTC (monthly data) | NNTC in trillions (monthly data) | NBSOPID (quarterly data) | NRTC (monthly data) | NRTC in trillions (monthly data) | NRTCPW (monthly data) | RGDP (quarterly data) | RGDP (monthly data) | RGDP in trillions (quarterly data) | RGDPPW (monthly data) | RGDPPWTNRTCPWR (monthly data) | RGDPPWTNRTCPWR regressed on months | RGDPPWTNRTCPWR regressed on months' errors | RGDPPWTNRTCPWRHW fitted values (monthly data) | RGDPPWTNRTCPWRHW forecasts (monthly data) | RGDPPWTNRTCPWRHW fitted values' real errors (monthly data) | RGDPPWTNRTCPWRHW fitted values' real errors from 1990-01-01 (monthly data) | RGDPPWTNRTCPWRHW model in sample plus one forecast | RGDPPWTNRTCPWRHW model in sample plus one forecast error | r | r_f | RGDPPW estimates | RGDPPW estimates' errors | RGDPPW estimates' proportional errors | RGDPPW estimates' errors every quarter | RGDP estimates | |
|---|---|---|---|---|---|---|---|---|---|---|---|---|---|---|---|---|---|---|---|---|---|---|---|---|---|---|---|---|---|
| 1950-01-01 | 57635000.0 | NaN | NaN | NaN | NaN | NaN | NaN | NaN | NaN | NaN | NaN | NaN | NaN | NaN | NaN | NaN | NaN | NaN | NaN | NaN | NaN | NaN | NaN | NaN | NaN | NaN | NaN | NaN | NaN |
| 1950-02-01 | 57751000.0 | 116000.0 | 0.002009 | NaN | NaN | 2.743384 | NaN | NaN | NaN | 2.808280e+11 | 2.808280e+11 | 0.280828 | 4862.738308 | NaN | NaN | NaN | NaN | NaN | NaN | NaN | NaN | NaN | NaN | NaN | NaN | NaN | NaN | NaN | NaN |
| 1950-03-01 | 57728000.0 | -23000.0 | -0.000398 | NaN | NaN | 2.743384 | NaN | NaN | NaN | NaN | 2.808280e+11 | 0.280828 | 4864.675721 | NaN | NaN | NaN | NaN | NaN | NaN | NaN | NaN | NaN | NaN | NaN | NaN | NaN | NaN | NaN | NaN |
| 1950-04-01 | 58583000.0 | 855000.0 | 0.014595 | NaN | NaN | 2.743384 | NaN | NaN | NaN | NaN | 2.808280e+11 | 0.280828 | 4793.677347 | NaN | NaN | NaN | NaN | NaN | NaN | NaN | NaN | NaN | NaN | NaN | NaN | NaN | NaN | NaN | NaN |
| 1950-05-01 | 58649000.0 | 66000.0 | 0.001125 | NaN | NaN | 2.706163 | NaN | NaN | NaN | 2.903830e+11 | 2.903830e+11 | 0.290383 | 4951.201214 | NaN | NaN | NaN | NaN | NaN | NaN | NaN | NaN | NaN | NaN | NaN | NaN | NaN | NaN | NaN | NaN |
| ... | ... | ... | ... | ... | ... | ... | ... | ... | ... | ... | ... | ... | ... | ... | ... | ... | ... | ... | ... | ... | ... | ... | ... | ... | ... | ... | ... | ... | ... |
| 2020-01-01 | 158714000.0 | -89000.0 | -0.000561 | 1.897381e+13 | 18.973810 | 1.002364 | 1.901866e+13 | 19.018660 | 119829.758771 | NaN | 2.172912e+13 | 21.729124 | 136907.418375 | 1.142516 | 1.164849 | 0.022333 | 1.149025 | NaN | 0.006509 | 0.006509 | 1.149025 | -0.006509 | 1.142516 | 1.149025 | 137687.388572 | -779.970196 | -0.005697 | NaN | 2.185292e+13 |
| 2020-02-01 | 158759000.0 | 45000.0 | 0.000283 | 1.907841e+13 | 19.078407 | 1.000000 | 1.907841e+13 | 19.078407 | 120172.128824 | 2.153794e+13 | 2.153794e+13 | 21.537940 | 135664.371784 | 1.128917 | 1.165553 | 0.036635 | 1.146024 | NaN | 0.017107 | 0.017107 | 1.146024 | -0.017107 | 1.128917 | 1.146024 | 137720.143764 | -2055.771980 | -0.015153 | 2.153794e+13 | 2.186431e+13 |
| 2020-03-01 | 155772000.0 | -2987000.0 | -0.019175 | 1.869631e+13 | 18.696312 | 1.000000 | 1.869631e+13 | 18.696312 | 120023.572914 | NaN | 2.153794e+13 | 21.537940 | 138265.798731 | 1.151989 | 1.166257 | 0.014268 | 1.137871 | NaN | -0.014117 | -0.014117 | 1.137871 | 0.014118 | 1.151989 | 1.137871 | 136571.342936 | 1694.455796 | 0.012255 | NaN | 2.127399e+13 |
| 2020-04-01 | 133403000.0 | -22369000.0 | -0.167680 | NaN | NaN | 1.000000 | NaN | NaN | NaN | NaN | 2.153794e+13 | 21.537940 | 161450.192275 | NaN | NaN | NaN | NaN | 1.143114 | NaN | NaN | 1.143114 | NaN | NaN | 1.143114 | NaN | NaN | NaN | NaN | NaN |
| 2020-05-01 | NaN | NaN | NaN | NaN | NaN | NaN | NaN | NaN | NaN | NaN | NaN | NaN | NaN | NaN | NaN | NaN | NaN | 1.143141 | NaN | NaN | NaN | NaN | NaN | NaN | NaN | NaN | NaN | NaN | NaN |
References
You can find more detail regarding the DSWS API and related technologies for this article from the following resources:
- DSWS page on the Refinitiv Developer Community web site.
- DSWS API Quick Start Guide page.
- DSWS Tutorial page.
- DSWS API Python Reference Guide.
For any question related to this example or Eikon Data API, please use the Developers Community Q&A Forum.
Literature: