| Last update | Jan 2026 |
Tutorials introduction purpose
You have a choice of 2 different platforms to access LSEG Tick History data:
- The DataScope servers, with their GUI and REST API, and the associated .Net SDK for C# programming.
- The GCP (Google Cloud Platform), where tick data can be queried using Google BigQuery. This capability was made available in November 2019.
These are two entirely different offerings.
This introduction covers the Tick History REST API, and its two series of tutorials. It also includes a few comments on creating custom projects for use with the .Net SDK.
For information on accessing Tick History data using the Google Cloud Platform and BigQuery, please refer directly to the third series of tutorials: Google BigQuery Tutorials.
Table of contents
- Introduction to the LSEG Tick History REST API
- Scheduled or On Demand: 2 approaches
- Instrument validation
- Overview of the tutorials
- .Net SDK tutorials content
- Different methods to create a custom .Net project
- REST API tutorials content
- Request tuning and best practices
Introduction to the LSEG Tick History REST API
The LSEG Tick History API is a REST API. There used to be a SOAP version, no longer usable as it has been deprecated since end 2017.
What are SOAP and REST ?
A Web service, in very broad terms, is a method of communication between two applications over the Internet.
Web services are of two kinds: SOAP and REST.
SOAP (Simple Object Access Protocol) defines a standard communication protocol specification for XML based message exchange. SOAP can use different transport protocols such as HTTP (HyperText Transfer Protocol) or SMTP (Simple Mail Transfer Protocol).
REST (REpresentational State Transfer) defines a set of architectural principles for data transmission over a standardized interface (such as HTTP). REST does not contain an additional messaging layer and focuses on design rules for creating stateless services. A client can access a resource using its unique URI (Uniform Resource Identifier), and a representation of the resource is returned.
Web services that use a REST architecture are called RESTful APIs (Application Programming Interfaces) or REST APIs. When accessing RESTful resources with the HTTP protocol, the URL of the resource serves as the URI, and the standard HTTP verbs GET, PUT, DELETE, POST and HEAD are the standard operations that are performed on that resource. REST is popular for cloud-based APIs, and Web services.
Capabilities of the LSEG Tick History REST API
- The LSEG Tick History API runs in a new environment to deliver the benefits of the REST architecture.
- It can programmatically find and download VBD (Venue By Day) data.
These are called Standard Solutions or Standard Extractions.
There are API calls to:
- List Subscriptions – they should include Venue by Day (VBD) data.
- List Packages – for VBD, these are the venues, i.e. exchanges.
- List Package Deliveries – for VBD, these are the actual data files.
There are several files per day, each containing different data.
Files are kept on the server for 30 days, after which they are no longer available.
Additional calls allow handling of very large lists of packages (paging), and change tracking.
Package Deliveries (VBD data files) can be retrieved using API calls, which will save the files to local hard disk. There is no need to FTP result files. This is demonstrated in the Tutorials. - It also offers rich bespoke Tick History extraction functionality, including methods for:
- Searching, validating, creating and managing lists of instruments and entities.
- Creating and managing report templates that define particular extractions and fields.
- Creating and managing schedules on the DSS server, to launch data extractions.
- Higher level calls for direct On Demand data extractions (without requirement for instrument lists, report templates or schedules).
Advantages of REST APIs over SOAP APIs
Generic advantages of REST APIs over SOAP APIs:
- RESTFUL APIs are generally speaking easier to work with, developers often prefer REST over SOAP. This can be debated, but in general REST APIs are very popular and in high demand.
- The RESTFUL API simplicity makes it easier to work with, especially with smaller devices that have a subset of capabilities.
- It also supports JSON (Java Script Object Notation) for backend parsing (SOAP only supports XML).
JSON parsing is fast and incurs little overhead on the servers.
Some languages have pretty mature XML parsers, making them slightly faster than JSON. But LSEG Tick History has a custom JSON serializer that is fast and incurs very little CPU and memory overhead on the servers, so the backend is pretty efficient using JSON. - It has better browser support, and REST reads can be cached.
- Generally speaking, REST has better performance and scalability.
Anecdotally, 85% of the Amazon calls are to the REST version of their API. Considering their huge client base, that tells us something about the appeal of REST APIs.
Relation between the LSEG Tick History REST API and DSS
The LSEG Tick History REST API connects to the same server as the DataScope Select (DSS) REST API; the server is called the DataScope server. Both APIs share some API libraries and mechanisms. This has several consequences:
- Both APIs share a common example application that demonstrates API calls for both APIs; this example application is called the REST API C# example application. It is explained in the Quick Start.
- You will find in some cases references to DSS instead of LSEG Tick History (notably in the name of this example application, in the code and the names of libraries). Do not get mislead by this, the API we discuss here is the LSEG Tick History REST API.
- LSEG Tick History customers will be provided a new DSS user ID for the REST API.
Availability of the LSEG Tick History REST API
The LSEG Tick History REST API is available to all LSEG Tick History customers.
The only requirement to access any of the API capabilities is a valid DSS username and password. These username and password will be provided to LSEG Tick History customers and are valid both in the API and the GUI.
Scheduled or On Demand: 2 approaches
Scheduled extractions
Scheduled extractions use instrument lists, report templates and schedules that are stored on the server, and visible in the web GUI. As they are persisted on the server, they can be re-used again and again.
Instrument lists define a list of instruments.
Report templates define the type of data and specific fields that one requires. A user report template is based on a standard report template, with a user defined set of data fields of interest, and some formatting options.
Schedules define when data should be extracted, and refer to an instrument list and a report template.
Instrument lists and report templates can be referenced by several schedules.
Instrument lists, report templates and schedules can be managed (created, updated, deleted) manually using the web GUI. They can also be managed using the REST API.
When a schedule triggers, a data extraction is launched. The resulting data is saved in a file on the server. The status of an extraction (pending, running, completed) can be checked manually, or using the API. The resulting data can be retrieved manually or using the API.
There are API calls that allow you to control the workflow just like you would using the web GUI. In other words, the API allows you to mimic the web GUI.
It is also possible to mix the manual and API methods, like for example creating the instrument list, report template and schedule manually in the GUI, then regularly updating the instrument list using the API, and retrieving the data using the API.
Several Java samples, available under the downloads tab, illustrate these capabilities. This is similar to what could have been done manually using the web GUI. What is created is stored on the server, but our samples and tutorials delete them at the end, to avoid cluttering up your environment.
Workflow
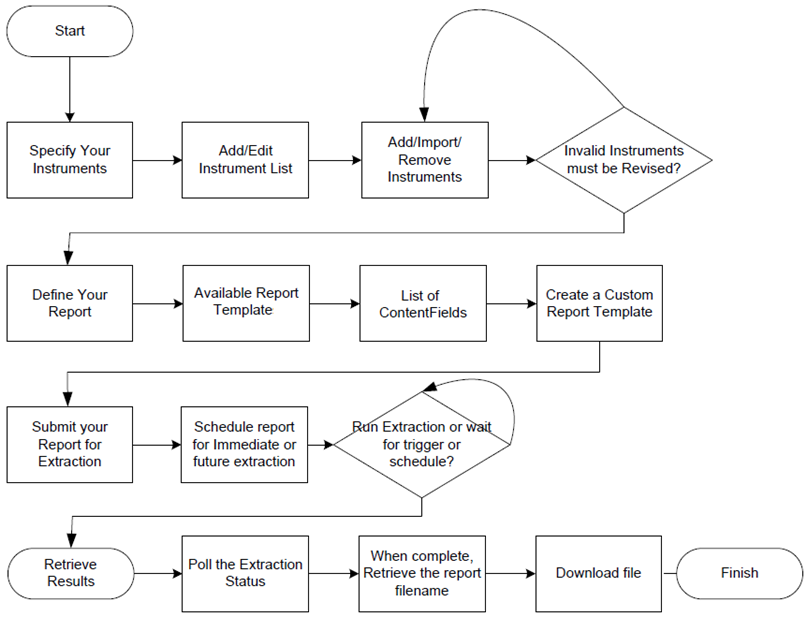
A scheduled extraction requires 5 steps, illustrated by the following diagram.
- The first line is the instrument list creation.
- The second line illustrates the creation of a customized report template by choosing a default one and selecting the data fields.
- The third line shows the schedule creation, and waiting for the extraction request to be triggered.
- The last line is for polling the extraction status, and retrieving the data.
Details of these steps:
- Create and populate an instrument list, which is saved on the server.
The list can be created, populated and modified manually using the GUI. It is also possible to import a CSV file.
The list can also be created, populated and modified using the API.
A list is persisted on the server until you decide to delete it.
Instruments are validated before being added to a list.
In this context, the instrument search tool allows you to find instruments, using various criteria, which can be very useful.
- Define a report template, which is also saved on the server.
Report templates are created by choosing one from a list of available default templates, and customizing it by selecting which data fields should be part of the returned results.
Again, this can be done using either the GUI or the API.
Many default report templates are available, for a wide range of pricing, reference, analytics, entity, commodities, estimates, corporate actions and news data.
The list of available fields is specific to each report template; it can be displayed in the web GUI or queried through the API. You can include as many of the available fields you want in the template, but for obvious performance reasons it is best to select only those you require. When analyzing the list of fields for a specific report template, each data field has a description, which helps in choosing the right one. In case of doubt, the best method is to select all potential candidate fields during the prototyping phase, then check the returned results to determine which fields return the data you require, and finalize the field list. This prototyping can easily be done in Postman, without coding. This exercise needs only to be done once, as field lists will usually not require changes.
- Define an extraction schedule, which is saved on the server.
It can be executed one single time, or run on a recurring basis.
It can be triggered at a specific time, or by data availability, like at market close, or after data corrections are available.
A schedule must refer to an existing instrument list and report template.
Combinations are of course possible; several schedules can be defined for the same instrument list, and the same or differing report template.
- Check the status of the extraction, by interrogating the server.
- Once it has completed, retrieve results from the server.
All these operations can be done using the GUI, or the API.
On Demand extractions
On Demand extractions use simplified high level API calls that create extractions on the fly. They do not have their equivalent in the GUI.
Instrument lists and report templates are not stored on the server, cannot be reused later and cannot be seen using the web GUI.
Instrument lists are stored on the client, and passed as a parameter to the API call.
The type of data (i.e. the default report template) is selected by the API call. The list of data fields of interest is passed as a parameter to the API call.
There is no schedule because these are On Demand requests.
REST API Tutorials 3 – 7 use these simplified high level API calls that create extractions on the fly. There is also a Java sample that illustrates this approach.
Workflow
An On Demand extraction requires 4 steps:
- Create an instrument list, but this is managed entirely on the client, it is not saved on the server.
Instruments can be searched using API calls, so automated workflows can integrate such capabilities.
- Submit an extraction request directly, specifying a data type, which, in fact, refers to a default report template.
This covers steps 2 and 3 of the scheduled workflow, in one single API call.
Even if the mechanism is different, we are referring to the same templates we saw previously.
The request contains the instrument list, refers to a default template, and includes a list of data fields, specific to the template.
If required, the list of available data fields can be queried using the API, thus facilitating automated workflows, but as stated before, for performance it is best to optimize the field list during the prototyping phase.
- Check the status of the extraction, by polling the server.
- Once it has completed, retrieve results from the server.
These operations can only be done using the API.
Note: nothing is persisted on the server, neither the instrument list nor the custom report template.
Venue by Day
VBD extractions (also called Standard Extractions) are a special case of On Demand extraction. Such data is indeed extracted on demand, but there is no need to define an instrument list (it is the entire universe of instruments for a venue), the report format is predefined, and the data sets are automatically generated after market close (one file per day per venue).
The workflow is therefore different: one only needs to check for the availability of the data, and retrieve it, typically on a daily basis.
This is illustrated by the .Net SDK Tutorial 2 and the REST API Tutorial 2.
Scheduled or On Demand ?
There is no good or bad way of doing things; it all depends on your use case. Scheduled extractions are typically used for data requests that are performed regularly. An example could be daily EoD (End of Day) data requests.
A few examples:
- For daily extractions with an unvarying instrument list, the instrument list, report template and schedule could be manually (or programmatically) created. The API would then be used to pick up extracted data on a daily basis.
- For daily extractions with a varying instrument list, the report template and schedule could be manually (or programmatically) created. The API would then be used to update the instrument list when required, and pick up extracted data on a daily basis.
- To service ad-hoc end user requests for specific data, On Demand extractions using the API are the easiest solution.
Instrument validation
Instrument validation options can be used to define the behavior of the API when validating instruments used in data extractions. The most common use case for this is to allow or disable historical instruments, like matured bonds, discontinued instruments or those that changed name (for instance RIC IBM.N). If historical instruments are not allowed then an extraction request will not return any data for them, and return a “Not found” error.
That said, there are other validation options to define what is to be done in other cases, like inactive instruments, open access instruments, which quote to use for dual-listed instruments, and more. These options can be viewed and modified in the General Preferences in the GUI:
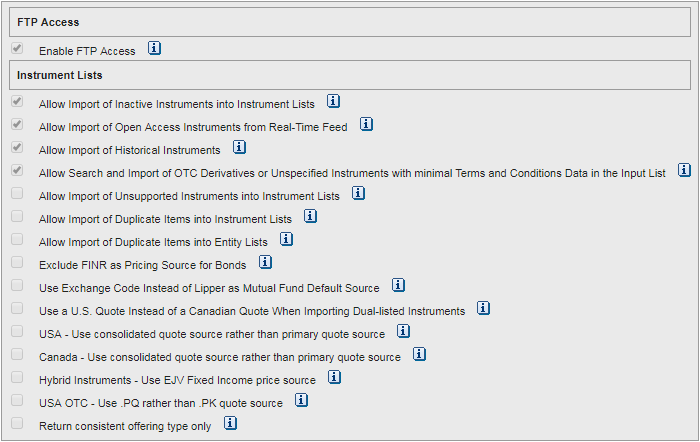
Important note: the preferences set in the GUI only apply to scheduled extractions; On Demand extractions ignore those settings, but the On Demand extractions API calls allow setting these values for individual requests.
To see a few examples of how this is done, please refer to the following:
.Net tutorial 3: scheduled request
.Net tutorial 4: scheduled request
.Net tutorial 5: On Demand request
REST tutorial 10: On Demand request
The Tick History REST API User Guide contains a short explanation under the Requirements heading in chapter 3, and the Terms and Conditions call in chapter 8 serves as an example.
Overview of the tutorials
Reviewing the Quick Start is highly recommended before starting on the tutorials.
2 sets of tutorials
There are 2 sets of tutorials:
- One set that uses the .Net SDK, for programming in C#.
- One set that shows the REST API HTTP requests and responses, for programming in other languages.
The .Net SDK tutorials
Like the C# example application covered in the Quick Start, the series of tutorials covers programming in C# with the LSEG Tick History REST API .Net SDK, in Microsoft Visual Studio.
The tutorials cover some (but not all) of the API calls, illustrating some typical use cases. Comments in the code and messages displayed on screen show progress through the code and explain the steps. The code can be modified to test and understand it better, and can be copied for re-use.
Each tutorial illustrates one or several key concepts.
Each tutorial is delivered in 2 versions: learning and refactored.
- The focus of the learning version is to illustrate the concepts and calls, while simultaneously being easy to follow. Its code is very much sequential.
- The refactored version has exactly the same functionality, but has been refactored, i.e. restructured to be more production oriented. Methods are split into 2 classes: DssClient.cs which contains methods that are directly related to working with LSEG Tick History, and Program.cs which contains the main program and helper methods.
The tutorials contain only limited error handling, to avoid burdening it and hindering the learning process.
It is strongly recommended to follow these tutorials in order, without skipping any, for the following reasons:
- Code and use case complexity increase through the tutorials.
- Tutorials re-use calls and methods created and explained in previous tutorials.
Pre-requisites to run the .Net SDK tutorials
The following are required:
- Microsoft Visual Studio.
- A valid DSS user account. This consists in a user name and password. These username and password will be provided to LSEG Tick History customers and are valid both in the API and the GUI.
- An internet connection to access the LSEG Tick History server.
The REST API tutorials in HTTP
This series of tutorials covers programming over HTTP with the LSEG Tick History REST API.
The tutorials are much more generic, and the calls illustrated in them can be reused in any programming environment that can make HTTP calls to a REST server. When writing these tutorials we ran the calls using a REST client application called Postman, but you can use any tool you like to experiment with this.
The tutorials cover some (but not all) of the API calls, illustrating some typical use cases. Each tutorial illustrates one or several key concepts. Comments in the tutorial explain the steps.
.Net SDK tutorials content
The tutorials cover coding in C# with the LSEG Tick HistoryREST API .Net SDK, in Microsoft Visual Studio.
.Net SDK Tutorial 1: Connecting to the server
This is the starting point and a pre-requisite for all the other tutorials, which will use the same libraries.
In this tutorial we:
- Download and install a single copy of the .Net SDK libraries, for use by all the tutorials in this series.
- Create a small project to create the work context, connect and authenticate to the DSS REST server.
.Net SDK Tutorial 2: Retrieving VBD files
In this tutorial we follow a simple scenario: download the latest VBD files of interest, once a day, for a set of exchanges. We:
- Retrieve the list of user packages for which we have permission (for the VBD subscription this corresponds to the list of venues, i.e. exchanges).
- Select a few, based on a list of exchange names we are interested in.
- For each selected user package, we:
- Retrieve the full list of users package deliveries (data files);
- Select those with the most recent date (i.e. the previous or current day);
- Select those where the file type is in our list of interest;
- Retrieve and save those files to local disk.
These steps illustrate a typical use case and use the API calls, except the filtering steps which do not require the API.
.Net SDK Tutorial 3: GUI control calls: list, report, schedule
This tutorial is an introduction to the 3 basic core DSS operations. We shall take programmatic control of the DSS web GUI by creating:
- An instrument list: a list of financial instruments for which data is requested.
- A report template: defines the format and fields list of requested data: in this case 5 fields of Intraday Summary (bar) data.
- A schedule: defines when the data will be retrieved: in this case it is an immediate extraction.
After that, to cleanup, we delete these 3 items.
.Net SDK Tutorial 4: GUI control calls: validate, extraction
This tutorial looks at more programmatic GUI control. Building on the previous tutorial, it covers the following new topics:
- Checking instrument identifiers validation results when creating an instrument list.
- Launching a data extraction on the DSS server, waiting for it to complete, and checking its status.
- Retrieving and displaying the retrieved data and extraction notes.
.Net SDK Tutorial 5: On Demand extraction, file IO
This tutorial moves away from the scheduled extractions which mimic what can be done using the GUI control, and covers a new topic: On Demand extractions, using as example an intraday summaries (bar) extraction.
In this tutorial we therefore use the simplified high level API calls for On Demand extractions. We also include some file input and output, and some error handling:
- Populate a large instrument list array read from a CSV file, outside of the DSS server. Errors encountered when parsing the input file are logged to an error file.
- Create an array of data field names, outside of the DSS server.
- Optionally set instrument validation parameters, for instance to allow historical instruments.
- Create and run an on demand data extraction on the DSS server, wait for it to complete.
- Retrieve and display the data and extraction notes. We also write them to separate files, and analyse the notes file to find issues.
The file input and output do not illustrate additional LSEG Tick History REST API functionality, but serve to put it in the context of slightly more productized code.
Different methods to create a custom .Net project
If you are new to Microsoft Visual Studio you might find this section useful.
The actions in the lists below are not meant to be followed as part of the tutorials, whose practical part starts in the next tutorial, .Net SDK Tutorial 1: Connecting to the server.
Before starting the practical tutorials, let us consider how you could proceed to create your own personal projects.
There are several alternatives. You could:
- Use one of the tutorial projects and modify it.
- Start a new project from scratch.
- Add LSEG Tick History REST API connectivity to an existing project.
To start from scratch here is one of the ways you could do it:
- Install the LSEG Tick History REST API .Net SDK (see .Net SDK Tutorial 1: Connecting to the server).
- Open Microsoft Visual Studio.
- Start a new project.
- Select as template a Console Application in Visual C#:

- Define its location and name
- Reference the LSEG Tick History REST API .Net SDK (see .Net SDK Tutorial 1: Connecting to the server).
- Start coding (possibly re-using copying code snippets from the REST API C# example application and/or the tutorials).
To add LSEG Tick History REST API connectivity to an existing project you would:
- Install the LSEG Tick History REST API .Net SDK (see .Net SDK Tutorial 1: Connecting to the server).
- Open your existing project in Microsoft Visual Studio.
- Reference the LSEG Tick History REST API .Net SDK (see .Net SDK Tutorial 1: Connecting to the server).
- Start coding (possibly re-using copying code snippets from the REST API C# example application and/or the tutorials).
Now that you have a better idea of what the LSEG Tick History REST API is about, and what the tutorials contain, you can proceed to the practical tutorials, which all use pre-built sample projects containing functional C# code.
REST API tutorials content
This series of tutorials covers programming over HTTP with the LSEG Tick History REST API.
The tutorials are much more generic, and the calls illustrated in them can be reused in any programming environment that can make HTTP calls to a REST server. When writing these tutorials we ran the calls using a REST client application called Postman, but you can use any tool you like to experiment with this.
The tutorials cover some (but not all) of the API calls, illustrating some typical use cases. Each tutorial illustrates one or several key concepts. Comments in the tutorial explain the steps.
REST API Tutorials introduction
This is an introduction to the REST API (pure HTTP) tutorials, covering two important topics:
- Using the REST API tutorials, and testing LSEG Tick History REST requests, with a pre-built REST client application.
This is a great way to easily test the LSEG Tick History REST requests and responses, and get started with the following tutorials. - Understanding the link between the C# example application and the REST API (pure HTTP) tutorials.
The C# example application displays the HTTP requests and responses for the many use cases it illustrates.
This knowledge can easily be re-used when programming HTTP requests, in any language.
REST API Tutorial 1: Connecting to the server
This is the starting point and a pre-requisite for all the other tutorials.
In this tutorial we:
- Connect and authenticate to the DSS REST server.
The received token will be required as authentication for every request. - Request user information, as a first example query, and as a mean to check our authentication token validity.
REST API Tutorial 2: Retrieving VBD files
In this tutorial we follow a simple scenario: download the latest VBD files of interest, once a day, for a set of exchanges. We:
- Retrieve the list of user packages for which we have permission (for the VBD subscription this corresponds to the list of venues, i.e. exchanges).
- Select a few, based on a list of exchange names we are interested in.
- For each selected user package, we:
- Retrieve the full list of users package deliveries (data files);
- Select those with the most recent date (i.e. the previous or current day);
- Select those where the file type is in our list of interest;
- Retrieve those files.
These steps illustrate a typical use case and use the API calls, except the filtering steps which do not require the API.
REST API Tutorial 3: On Demand data extraction workflow
This tutorial is a prerequisite for the following tutorials.
It explains the workflow for a raw data extraction (using On Demand extraction requests):
- Retrieve the available field list from the server.
This is only required if you do not know the exact names of the data fields you want to retrieve. - Request data from the server, using an on demand request.
- Check the request status.
- Retrieve the data.
It also gives some tips on request tuning and best practices to enhance performance.
REST API Tutorial 4: On Demand tick data extraction
In this tutorial we retrieve historical tick data, also called time and sales data, using an On Demand extraction request, following the workflow explained in the previous tutorial. We:
- Retrieve the available field list from the server.
This is only required if you do not know the exact names of the data fields you want to retrieve. - Request historical tick data from the server, using an on demand request.
- Check the request status.
- Retrieve the data.
REST API Tutorial 5: On Demand market depth extraction
In this tutorial we retrieve historical market depth data, in other words the top of the order book, using an On Demand extraction request.
The steps we follow are the same as for the previous tutorial, only the nature of the requested data changes.
REST API Tutorial 6: On Demand intraday bars extraction
In this tutorial we retrieve historical intraday bar data, in other words interval summarized market data, using an On Demand extraction request.
The steps we follow are the same as for the two previous tutorials, only the nature of the requested data changes.
REST API Tutorial 7: On Demand End of Day data extraction
In this tutorial we retrieve historical End of Day (EoD) data, in other words daily bars, using an On Demand extraction request.
The steps we follow are the same as for the three previous tutorials, only the nature of the requested data changes.
REST API Tutorial 8: On Demand raw data extraction
In this tutorial we retrieve raw data, in other words raw data messages as delivered by the exchange venues, using an On Demand extraction request.
The steps we follow are practically the same as for the four previous tutorials, only the nature of the requested data changes, and there is no field list for such exctractions.
REST API Tutorial 9: On Demand corporate actions extraction
In this tutorial we retrieve historical corporate actions data, in other words dividends, coupon payments, stock splits, etc., using an On Demand extraction request.
The steps we follow are similar to those of the previous tutorials.
REST API Tutorial 10: On Demand historical reference extraction
In this tutorial we retrieve historical reference data, using an On Demand extraction request.
The use case is to cross reference instrument codes, i.e. retrieve several instrument codes (RIC; Cusip, ISIN, Sedol, etc), for a list of instruments (with different instrument codes). For each input instrument code, all RICs are returned.
In this tutorial, the instrument list includes historical instruments, which are no longer quoted. For that reason we also set instrument validation options, to ensure we get data for the historical instruments as well.
The steps we follow are similar to those of the previous tutorials.
REST API Tutorial 11: On Demand extraction: instrument list
In the previous tutorials we created an instrument list on the fly. This one shows how to use a pre-existing instrument list
REST API Tutorial 12: GUI control calls: immediate extraction
This tutorial goes through the basics of programmatic GUI control. Instead of using an On Demand extraction, which is a simplified query, it performs a whole set of actions that could also be done manually in the web GUI. For an explanation on these two approaches, look at section: Scheduled or On Demand: 2 approaches.
This tutorial explains how to:
- Retrieve the available field list from the server.
- Create an instrument list.
- Create a report template.
- Schedule an immediate extraction.
- Check the extraction status.
- Retrieve the extraction report.
- Retrieve the data from the DSS server.
REST API Tutorial 13: Historical Search
In this tutorial we illustrate how to make historical search requests, with 2 use cases.
REST API Tutorial 14: Historical Criteria Search
In this tutorial we illustrate how to make historical criteria search requests, with 2 use cases.
REST API Tutorial 15: Historical Chain Constituents Search
In this tutorial we illustrate how to make historical chain constituents search requests.
REST API Tutorial 16: Search by Instrument
Important note: contrary to the historical search capabilities described in the previous tutorials, this search capability (and the following ones) only returns instruments that are currently active, it will not include historical instruments.
In this tutorial we:
- Search the DSS server by using the instrument code.
2 examples are given, one by RIC, one by OrgId.
This tutorial also illustrates how to validate a list of instruments, and how to return results in a different instrument code type.
REST API Tutorial 17: Search for an Equity
In this tutorial we:
- Search the DSS server for an equity, using as criteria the exchange and the ticker (other criteria are also available).
REST API Tutorial 18: Search for a Future or Option
In this tutorial we:
- Search the DSS server for a future or option, using as main criteria the strike price and the expiration date (other criteria are also available).
- Use a wildcard for the identifier.
Request tuning and best practices
Before you start programming, study the content of all the Key Mechanisms pages, they deliver very useful information on:
- Authentication
- Async mechanisms
- Server-driven paging (fetching large data sets using multiple requests)
- Change tracking (requesting changed data)
- Streaming data (retrieving data)
- Validation messages
and more.
Also note that requests for raw data, tick data and market depth data can generate very large result sets. To optimize the retrieval times, see the Best Practices and Limits for Tick History document in the Development section under the Documentation tab.