Purpose
This tutorial is the first in a series on LSEG Tick History data inside Google BigQuery.
After an introduction on the underlying technology, it explains how to set-up an environment in the Google Cloud Platform (GCP) console, how the data is structured, and how to examine the data.
The following tutorials cover data retrieval, filtering, and analytics on the data.
For a higher-level explanation of LSEG Tick History, Google Cloud Platform and BigQuery, and the use cases for this offering, please refer to the Tick History in Google BigQuery article.
Prerequisites
To run the sample queries delivered with this tutorial you need:
- Access to the Google Cloud Platform, with BigQuery access. For information on this, refer to the Google BigQuery pages.
- A Google ID that was entitled for LSEG Tick History. For this, please contact your LSEG account manager.
- Some knowledge of Tick History data, and SQL (Structured Query Language).
The technology
Google Cloud Platform and BigQuery
Google allows queries to be submitted in different ways that include a graphical user interface, a command line tool, or through an API using a variety of client libraries such as Java, .Net or Python. This tutorial uses the Google Cloud Platform (GCP) console, an interactive GUI.
Queries use SQL (Structured Query Language), a familiar and quite powerful industry standard query language. Both the standard and legacy SQL dialects are supported by BigQuery.
For more details, extensive documentation and training guides, please refer to the Google BigQuery documentation.
Tick History data in BigQuery
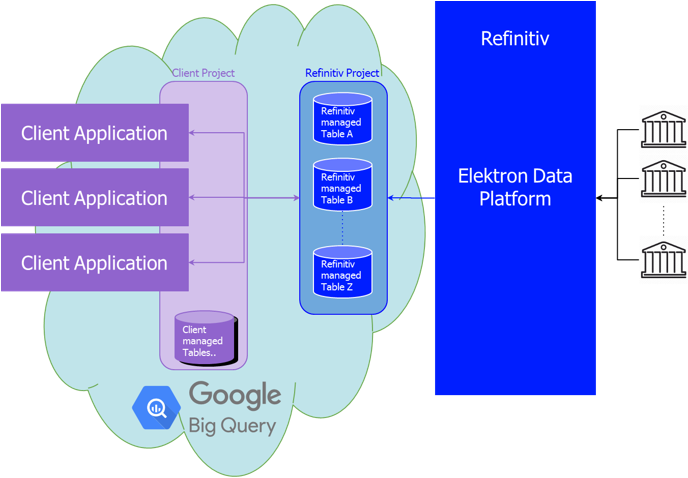
In the Google cloud, we created a project dedicated to Tick History. Inside that, we created columnar data tables for normalized tick history data, on a per venue basis, and partitioned them by day. These tables have been populated with historical data, and are updated daily, a short time after the content sources embargo period expires.
Access to these tables is subject to entitlements, based on your Google ID.
The initial offering has 10 years of history (MiFID II venues start from 2018), for a subset of all venues. The breadth of coverage and depth of history will be extended in the future.
Adjacent content sets, like corporate actions or reference data, will also be made available in BigQuery in a future release; in the meantime, they are accessible via the LSEG Tick History REST API (using the LSEG DataScope Select servers), or the Refinitiv Data Platform.
Configuring a GCP project to access Tick History
Let us see how to do this in the in the GCP (Google Cloud Platform) console.
To access the LSEG Tick History data sets from your own projects, you need to access the appropriate project.
Start by logging into GCP using a Google ID that was entitled for LSEG Tick History; if you are unsure about which ID that may be, please contact your LSEG account manager.
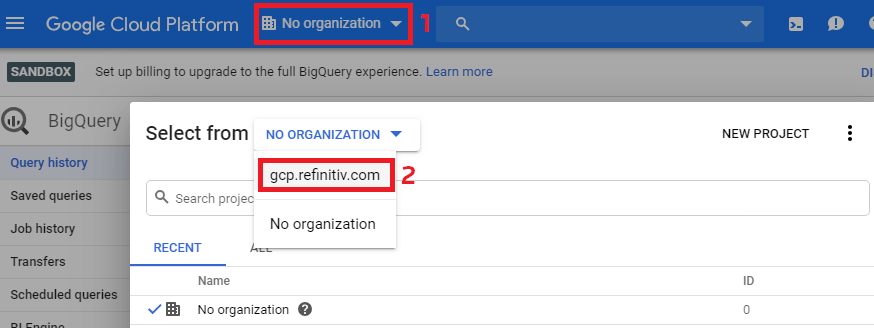
Select the GCP.REFINITIV.COM organisation:
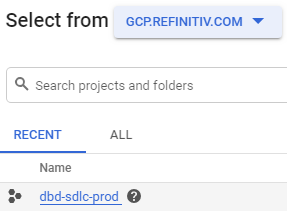
Then find and select the project called dbd-sdlc-prod:
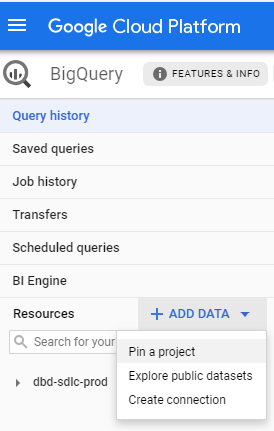
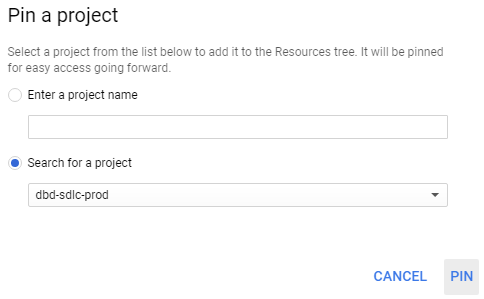
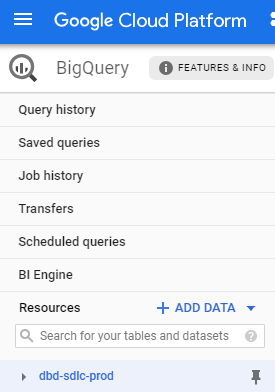
Pin the dbd-sdlc-prod project:
Once you have done this, you will be able to examine the tick history data and run queries on it from within your own BigQuery project.
Tick History data views
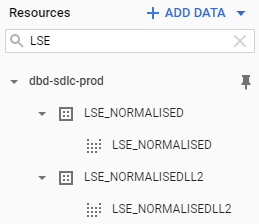
Opening the project we just pinned, we see a list of data sets. Their name is in the format <venue>_<view>. The venue is the data source; most of the time this is an exchange. There are two views:
- NORMALISED Tick data (Quotes, Trades, etc.)
- NORMALISEDLL2 Market depth
The market depth view is only available for markets where such data exists. The number of levels of order book depth varies on a per exchange basis.
Let us look at some data, using as example the London Stock Exchange (LSE):
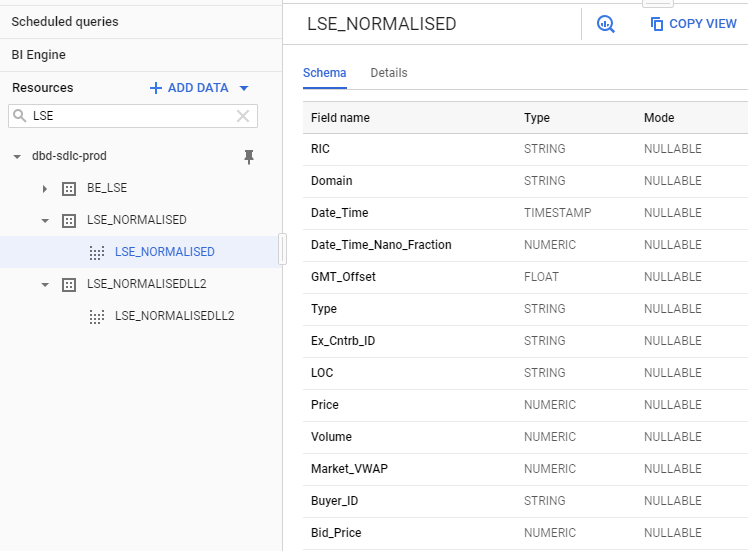
Let us click on the NORMALISED view:
We discover the data schema, with all the available fields:
This allows us to find all the field names and types, which will be useful when we query the data.
Next step
Now that we have found the data and understood its schema, we can move on to interrogate it, using SQL queries. Please proceed to the next tutorial that covers data retrieval and tick filtering.
