| Tutorial Source Code |
Examples referenced:
|
| Last Update | March 2022 |
| Compiler/Runtime | See Getting Started with TypeScript. |
| Pre-requisites | Enable the session environment as outlined within the Getting Started guide. |
Overview
Whether accessing from the desktop or directly to the cloud, the Refinitiv Data Libraries provide ease-of-use interfaces to retrieve content defined within standard web-based APIs. Built on top of the request-response paradigm, the library includes HistoricalPricing interfaces that allow developers to retrieve Intraday and Interday time-series historical pricing data available within the platform.
The following tutorial demonstrates the retrieval of time series pricing data defined within RDP Historical Pricing services. Specifically, we'll show basic retrieval of Interday, intraday summaries data, as well as pricing events (i.e. trades, quotes) and discuss how the response data is collected and extracted.
Time Series Intraday and Interday Summaries
The Historical Pricing Summaries interface defines an Interval specification that determines the time scale of data to retrieve from the back-end. For example, if we're interested in Intraday intervals, we are presented with the options to choose 1-minute, 5-minute, 10-minute, 1-hour, etc time buckets. Alternatively, if the interest is to select Interday intervals, we can choose 1-day, 1-week, 1-month, 1-year, etc.
// retrieve Intraday Summaries with 1-minute interval. Specify to capture only 12 rows.
const request1 = HistoricalPricing.Summaries.Definition({
universe: 'IBM.N',
interval: HistoricalPricing.Summaries.IntradayInterval.ONE_MINUTE,
fields: ['TRDPRC_1', 'HIGH_1', 'LOW_1', 'OPEN_PRC', 'NUM_MOVES'],
count: 12
});
const response1 = await request1.getData(session);
In addition to specifying the Intraday interval, the interface also provides a number of other properties, including the ability to select specific fields to pull down from the service, specifying the number of data items, a date range, etc. By default, all fields will be returned from the backend service if no fields are specified.
Note: The fields defined are based on the type of asset. For example, the time-series fields offered for equities will be different than those provided for fixed income instruments.
To choose interday summaries, this can also be done by selecting the interval.
// retrieve Interday Summaries with 1-day interval and all the fields
const request2 = HistoricalPricing.Summaries.Definition({
universe: 'IBM.N',
interval: HistoricalPricing.Summaries.InterdayInterval.DAILY,
count: 5
});
const response2 = await request2.getData(session);
Time Series Events (Quotes and Trades)
The Historical Pricing Events interface provides the ability to retrieve trades, quotes, or corrections for a specified instrument. By choosing a specific event type, the backend will select the most recent events or select events based on a specified time range.
// retrieve tick pricing events, default 20 rows of data. Specified trades only and specific columns of data.
const request1 = HistoricalPricing.Events.Definition({
universe: 'IBM.N',
eventTypes: ['trade'],
fields: ['DATE_TIME', 'EVENT_TYPE', 'TRDPRC_1', 'TRDVOL_1']
});
const response1 = await request1.getData(session);
In all code segments defined, the number of rows returned from the server is dependent on a number of criteria. By specifying a count within the definition, the value represents the maximum number of data items returned. If the count is smaller than the total amount of data of the time range specified, some data (the oldest) will not be delivered. To retrieve all available data within the time range specified, this parameter should not be specified. The returned data could be less than the number requested if there are not enough data within the time range specified. If not specified, the count will default to 20 unless both the start and end parameters are also specified. The maximum returned data is 10,000. The minimum value for count is 1.
Data structure returned
Whether accessing summaries or events, the structure and format of the data returned are the same. All request-reply responses will carry standard response details such as the success of the response, HTTP status details, which include reasons why the request may fail, and a data section containing details specific to the service. The structure and format of the data returned from the Historical Pricing services contain a table representing the time series data.
The following code segment determines if the request was successful, using a simple boolean property available within the response. Upon success, we begin to extract and display details populated within the data. Upon failure, the details of why the underlying HTTP request failed are displayed.
if(response1.data.table) {
console.log('Historical Trade events');
console.table(response1.data.table);
}
The table of data representing the time series is organized as a 2-dimensional grid of rows and columns. The rows represent the data over time and the columns contain the specified fields of interest.
Executing the Application
In our examples, we've prepared a few specific segments of code demonstrating the basics of retrieving summary and event data. To demonstrate our summary time series requests, choose the summary example within the source code package. To execute the example, refer to the pre-requisites section at the top of this tutorial.
The expected output should look similar to this:
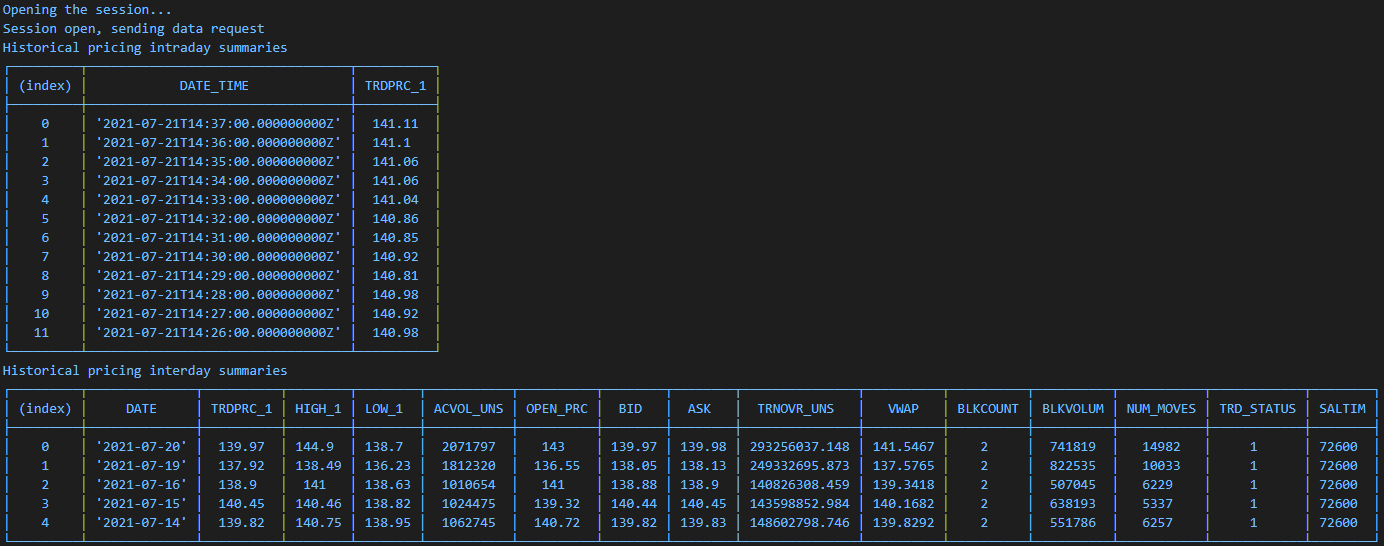
The first example showing intraday time series defines a count of 2 rows for a given list of fields, whereas the second example does not define a count thus defaults the result set. As you can see, the second example brought back a maximum of 20 rows representing the most recent data. If a date range was specified, the result set would return all data rows within the specified date range.
The Historical Pricing interfaces defined within the Refinitiv Data Library include other useful features based on the corresponding endpoint features. Refer to the tutorial package for additional examples. In addition, we encourage the use of IntelliSense documentation within your Visual Studio editor to discover other useful capabilities.